Customize Presentation
Last Updated: Nov 20, 2020
Last Updated: Nov 20, 2020
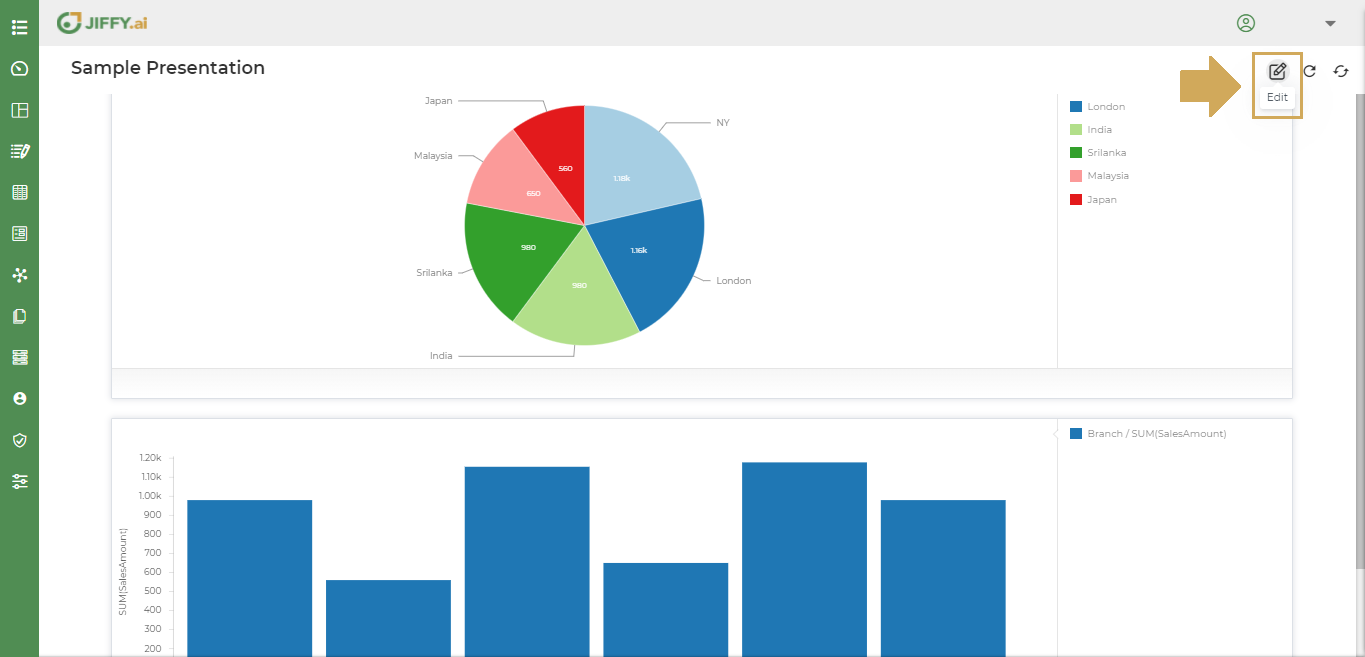
The user can edit the created presentations to enhance the visual effects of the Dashboard. This will also help in easy readability of presentations.
Click on Edit button to edit the Dashboard.
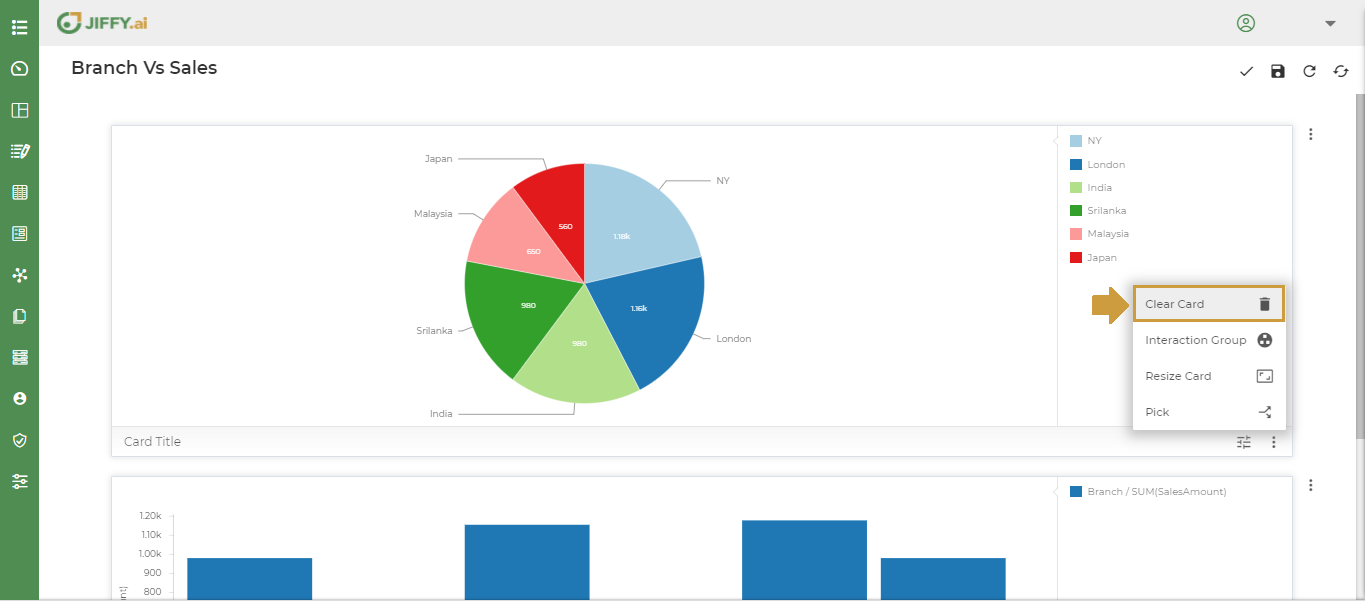
Click on More Button(Vertical 3 dots) to customize Presentation.
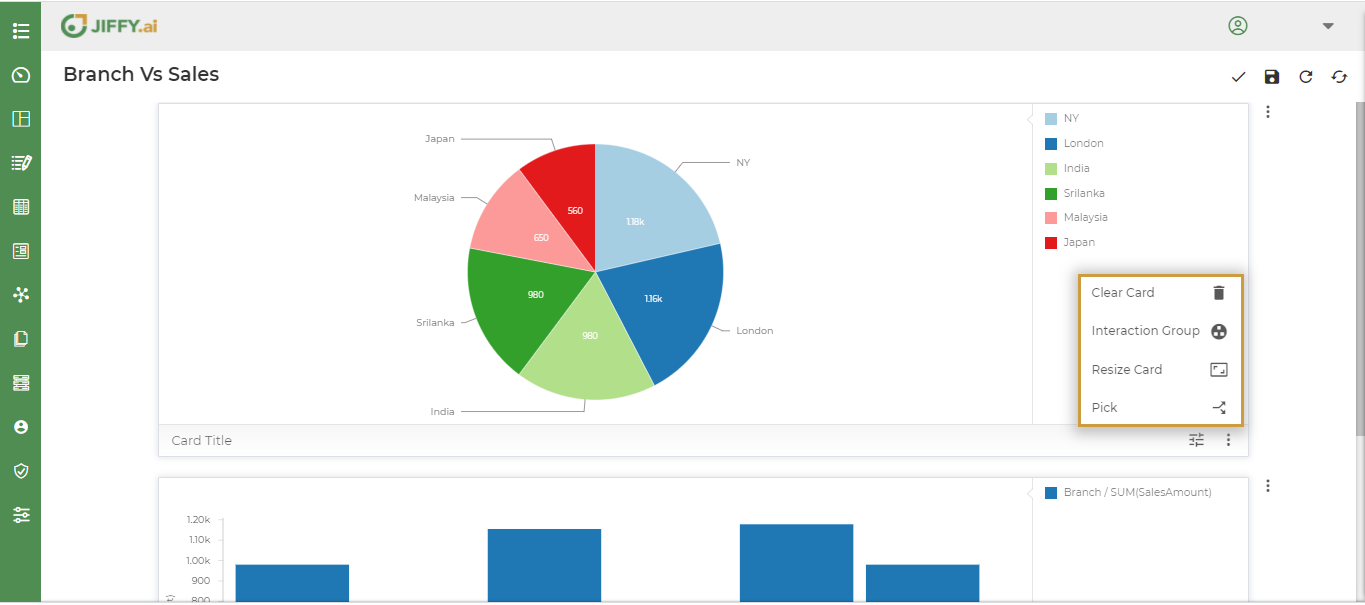
A popup screen appears with the following options
With this feature, the user can create multiple cards on the same dashboard.
Choose the Resize Card option.
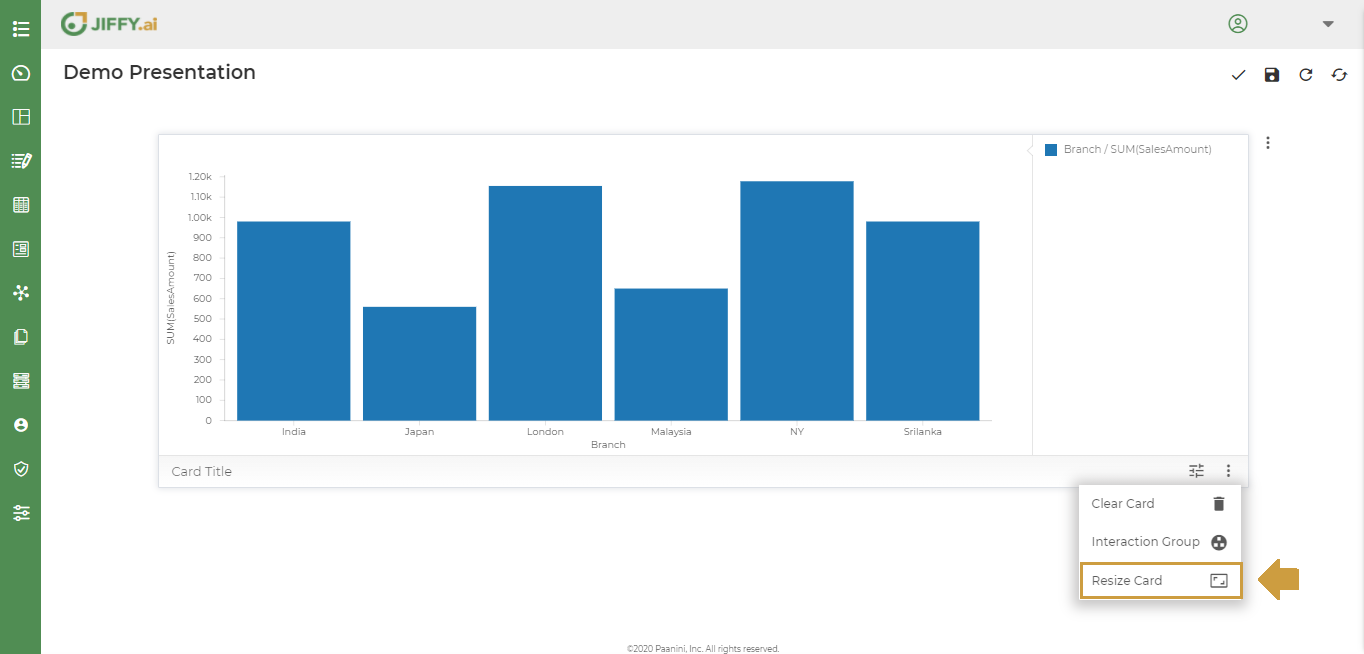
The following screen appears, then the user can select the Resize Icon on any of the positions. E.g.: If the user selects the position as shown below
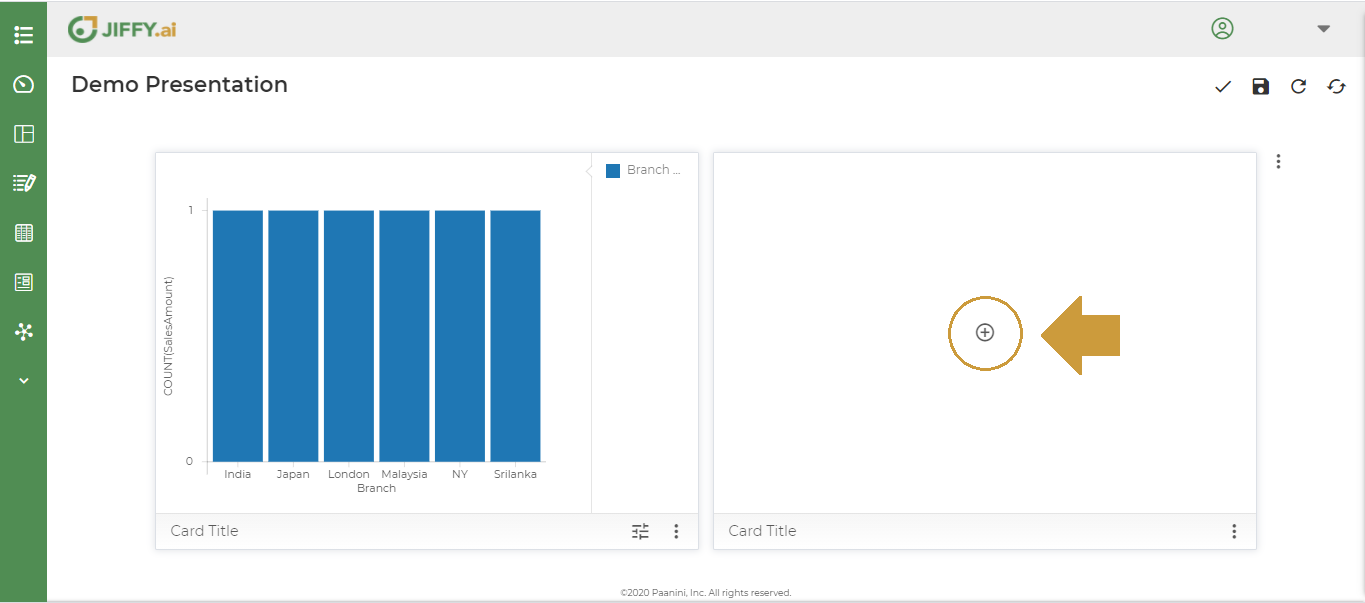
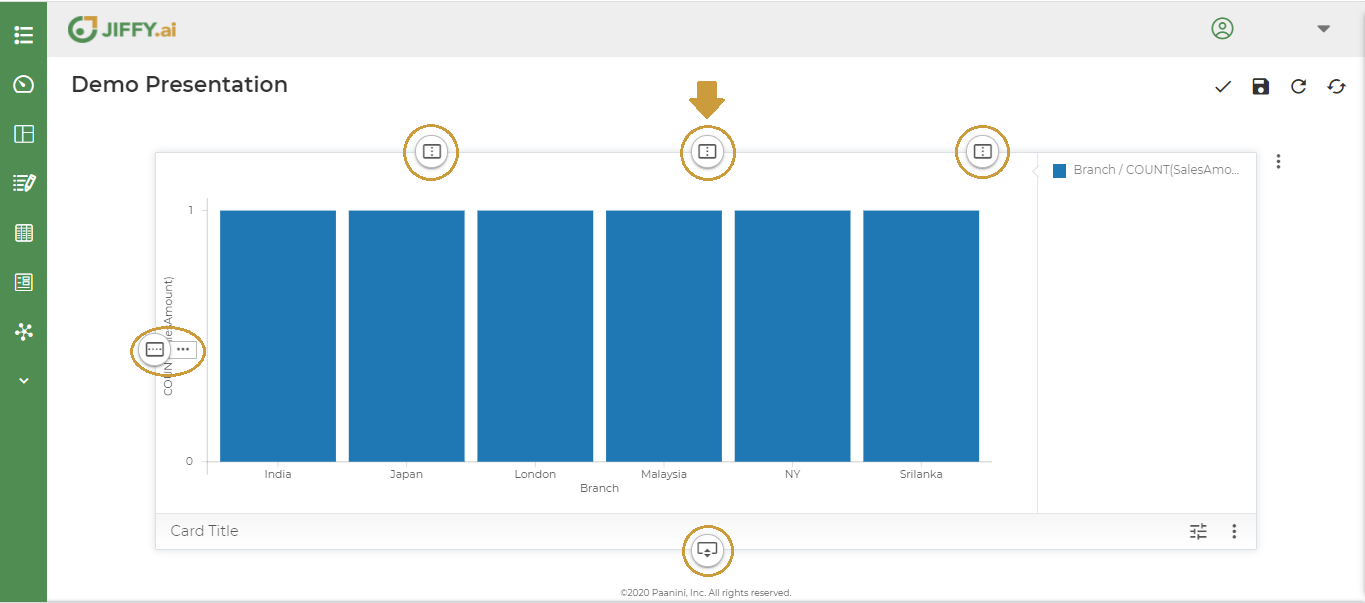 At that position, the card resizes and then the user can add another card.
To create new card refer to: Create Presentations
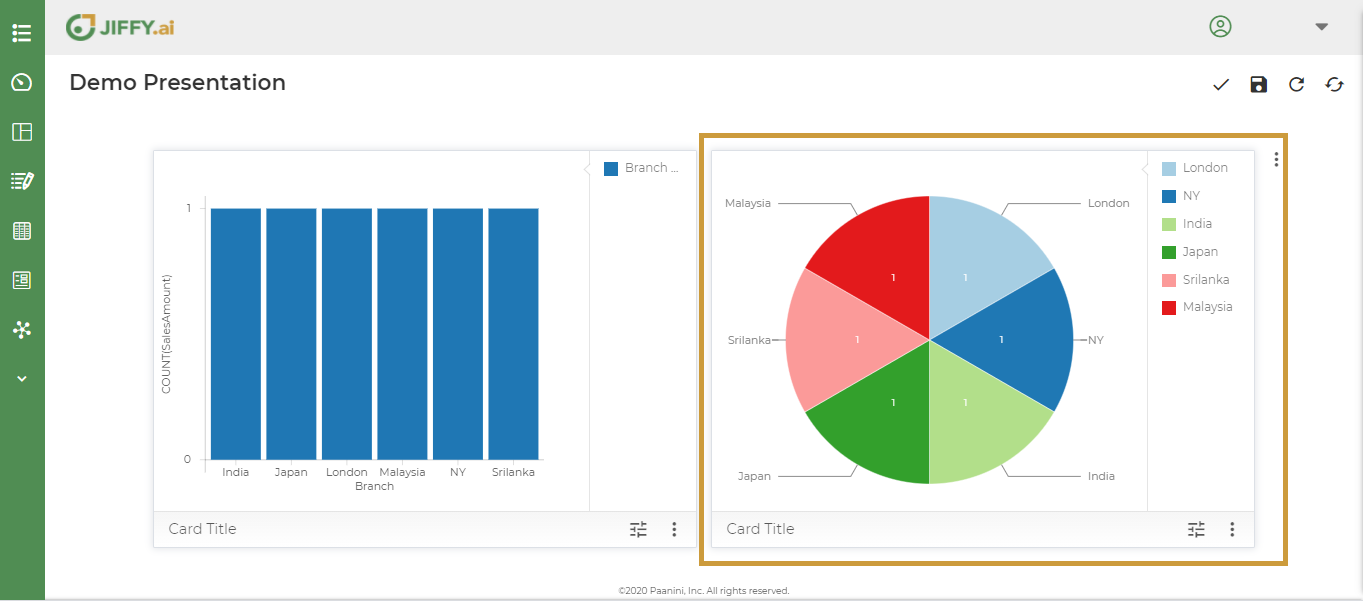
The dashboard after adding pie chart as the second card.
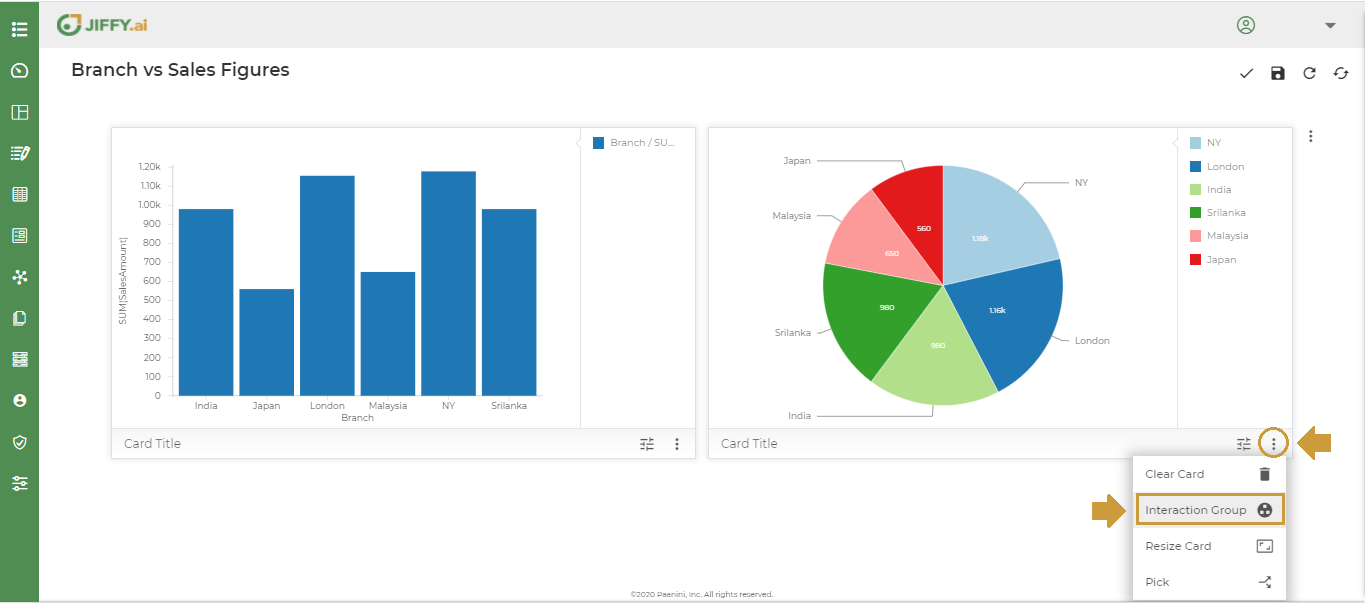
With this feature, the user can bring in interactivity between the charts, which means that when the user filters one chart to view specific data, the other charts in the presentation shows data specific to the same filter.
To create Interaction Group, first create two charts as shown and then add interaction group between them.

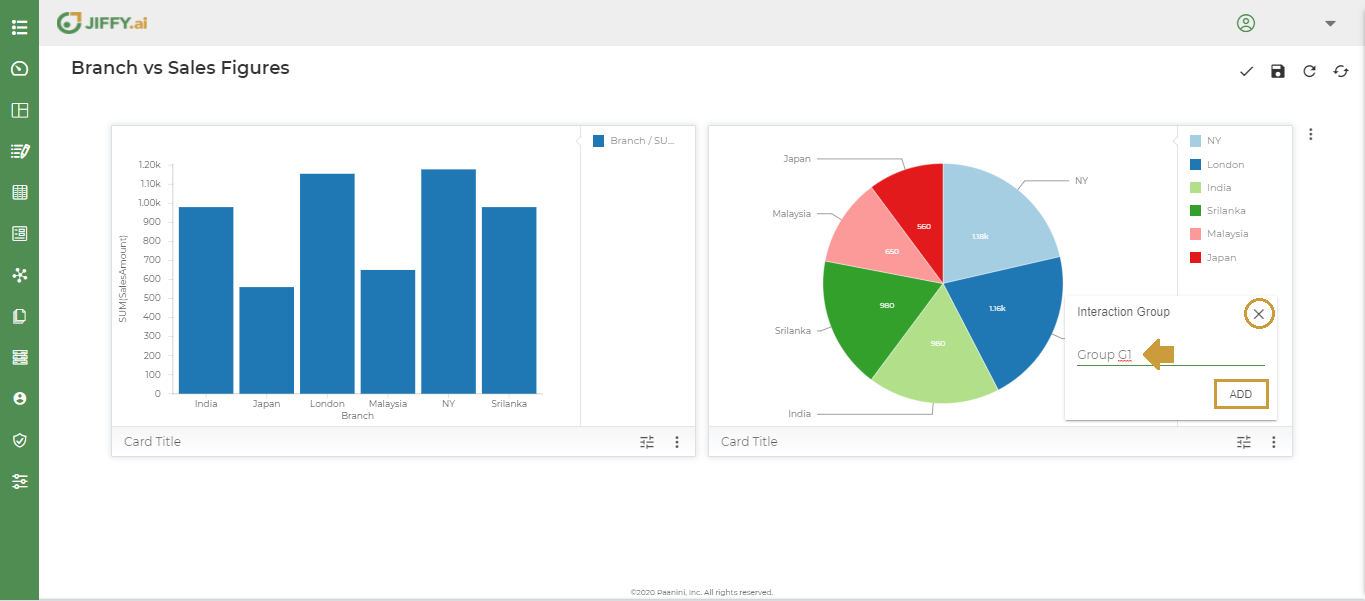
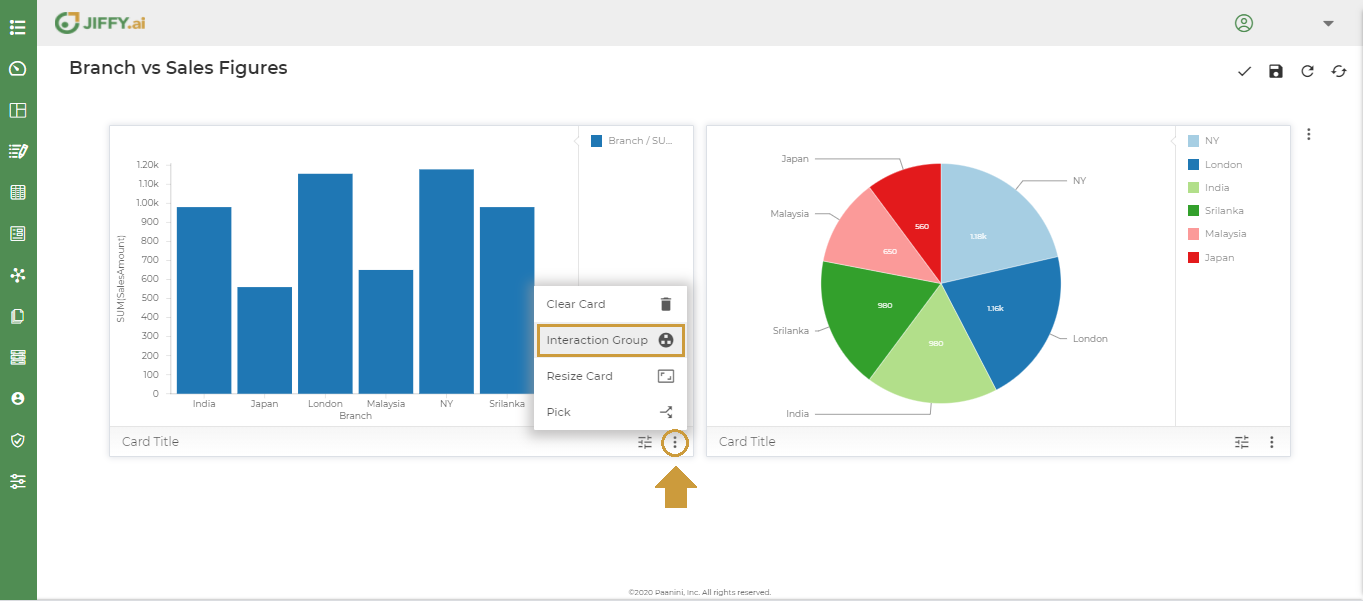
Click on the More Button(Vertical 3 dots) on any one of the cards and select Interaction Group
Enter a name for Interaction Group say “Group G1” and click on ADD.
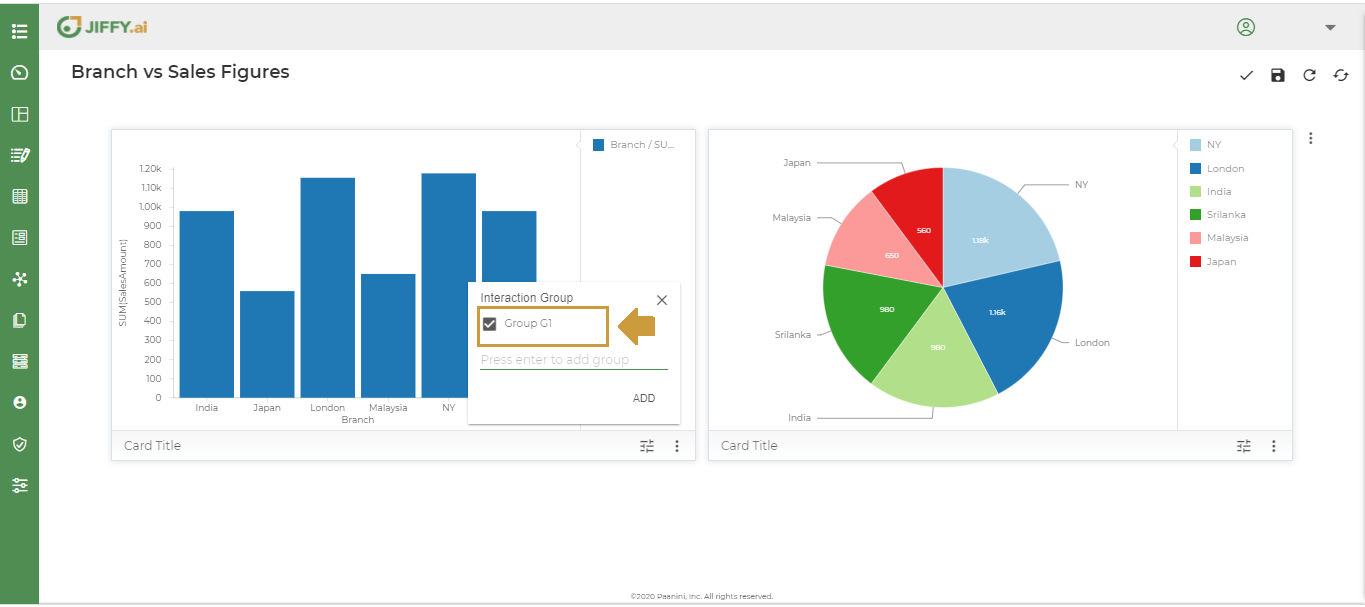
Click the More Button(Vertical 3 dots) in the Vertical Bar Chart.
Select the Interaction Group “Group G1”.
Now, select any one section of data in one of the charts to see it reflect in the other charts simultaneously.
In the example below, on clicking on the section for “Branch” NY the corresponding section in the vertical chart in the left is also highlighted
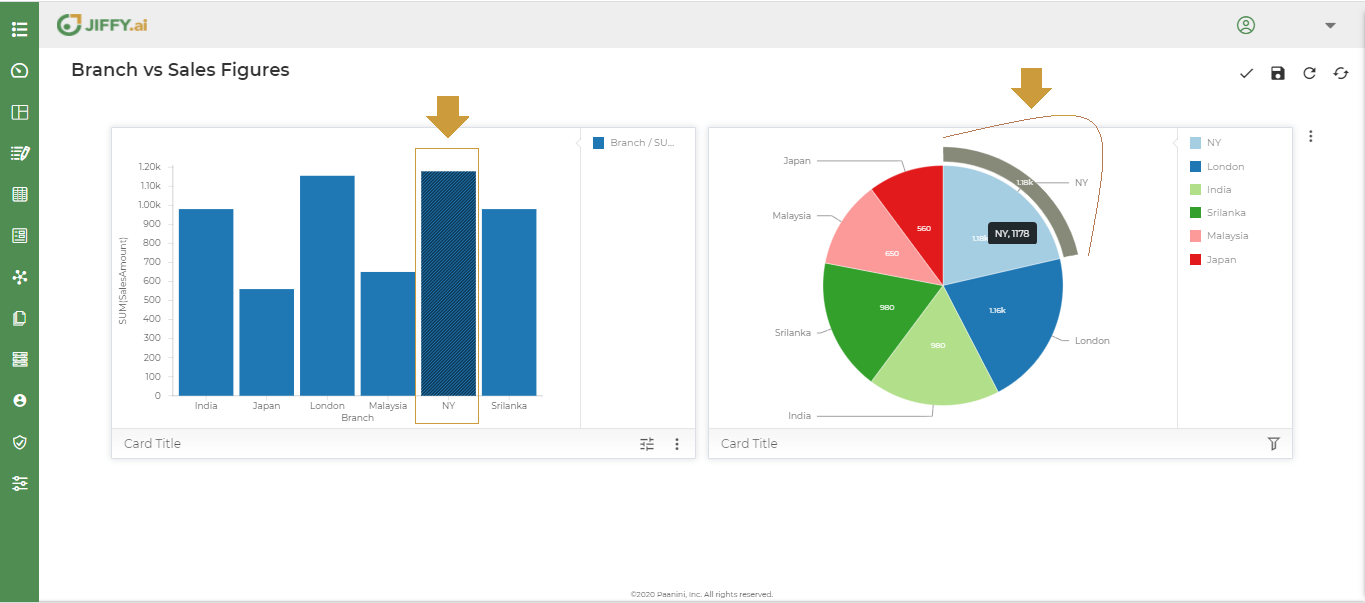 This way user can create interaction groups between multiple charts on the presentation to create a visual filter reflected across all the charts in the dashboard. This is called whole to part view.
Now when the filter is removed from one of the charts, it is also removed from the other interacting charts
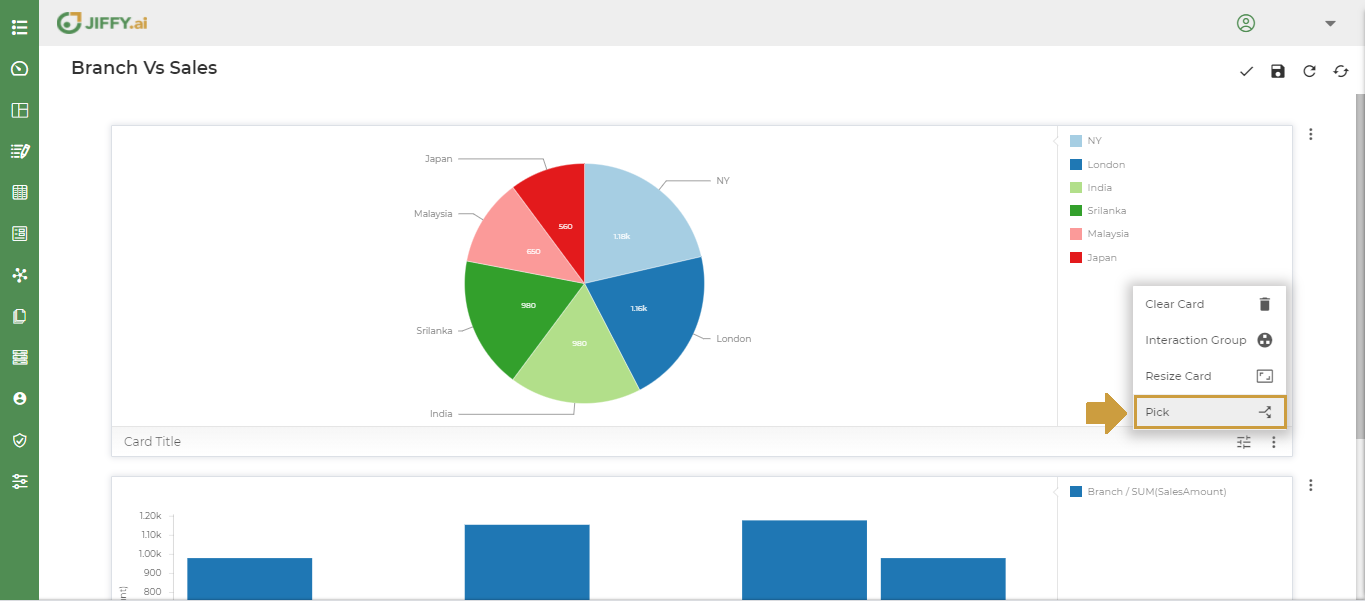
Using this feature, the user can swap the card positions.
Click on the Pick option to pick.
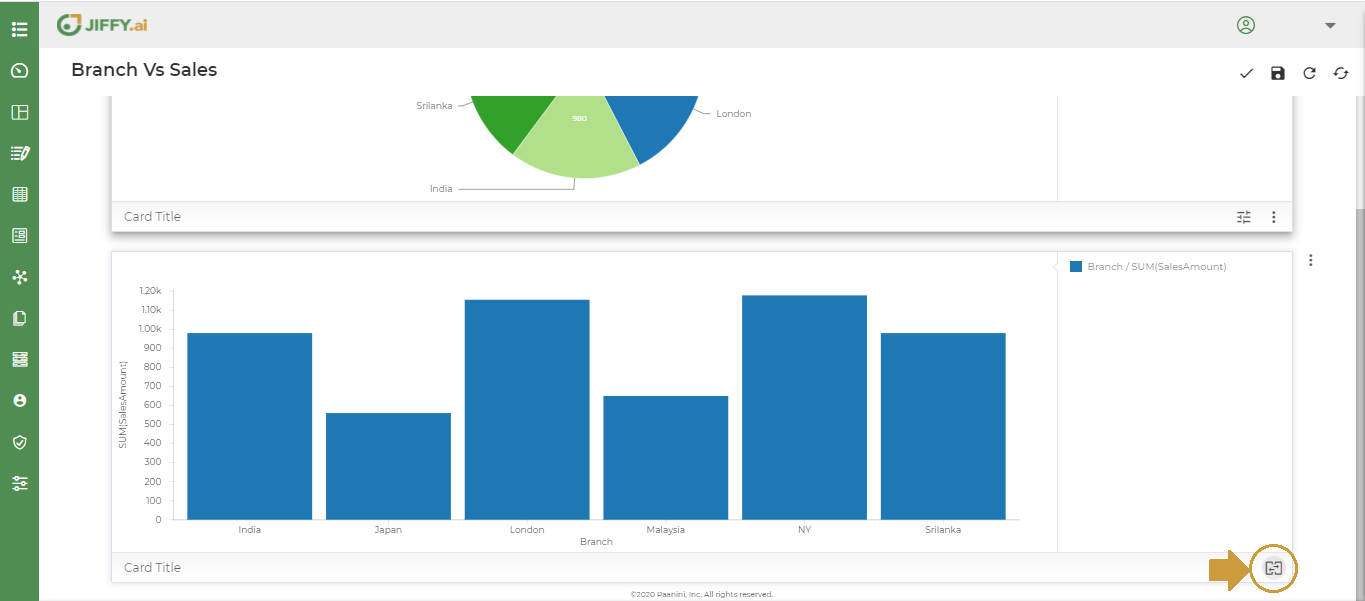
Click on the Unpick option to swap.
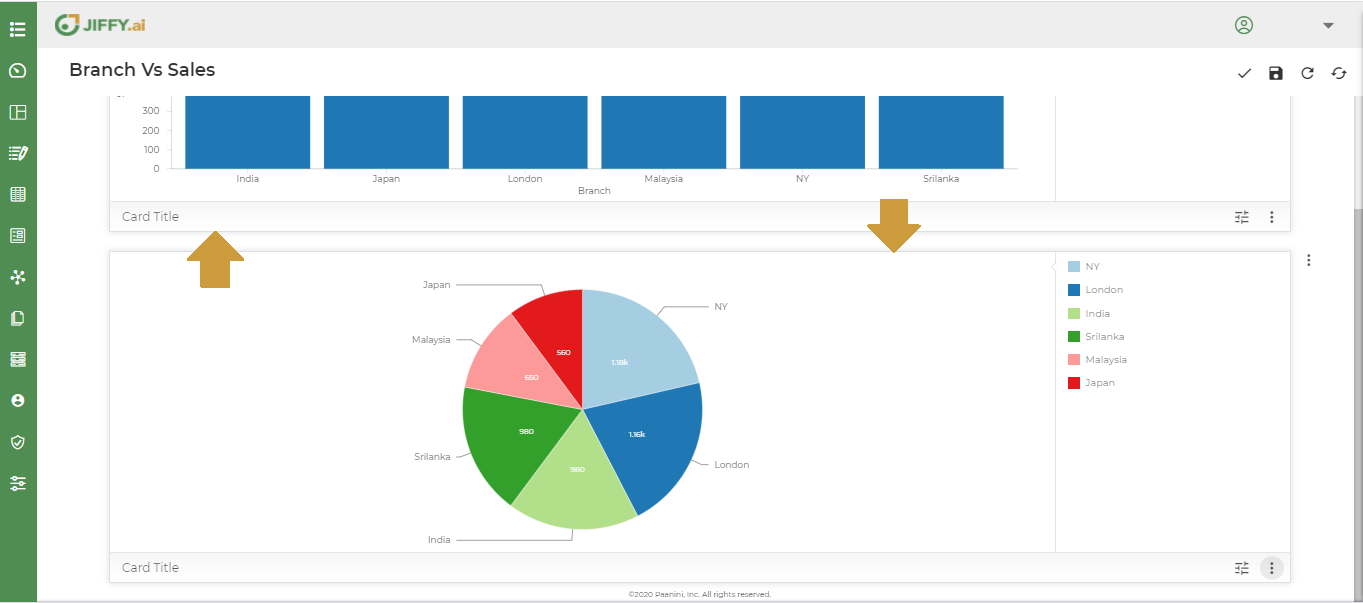
In the below screen,the card positions are swapped.
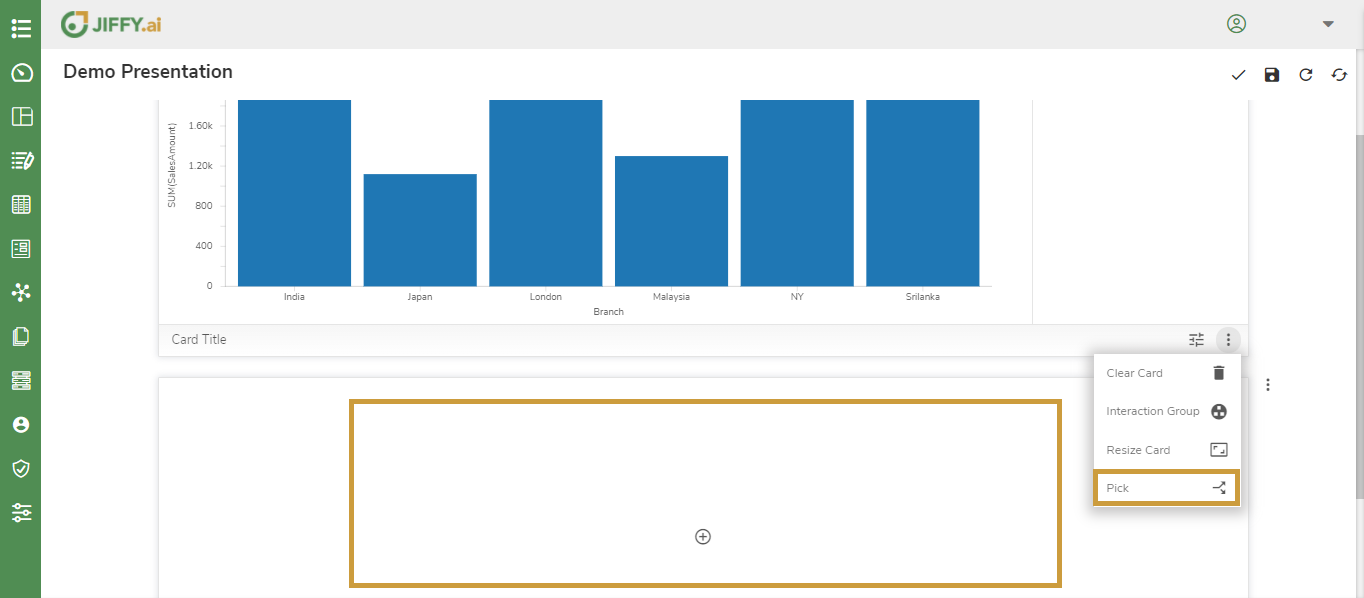
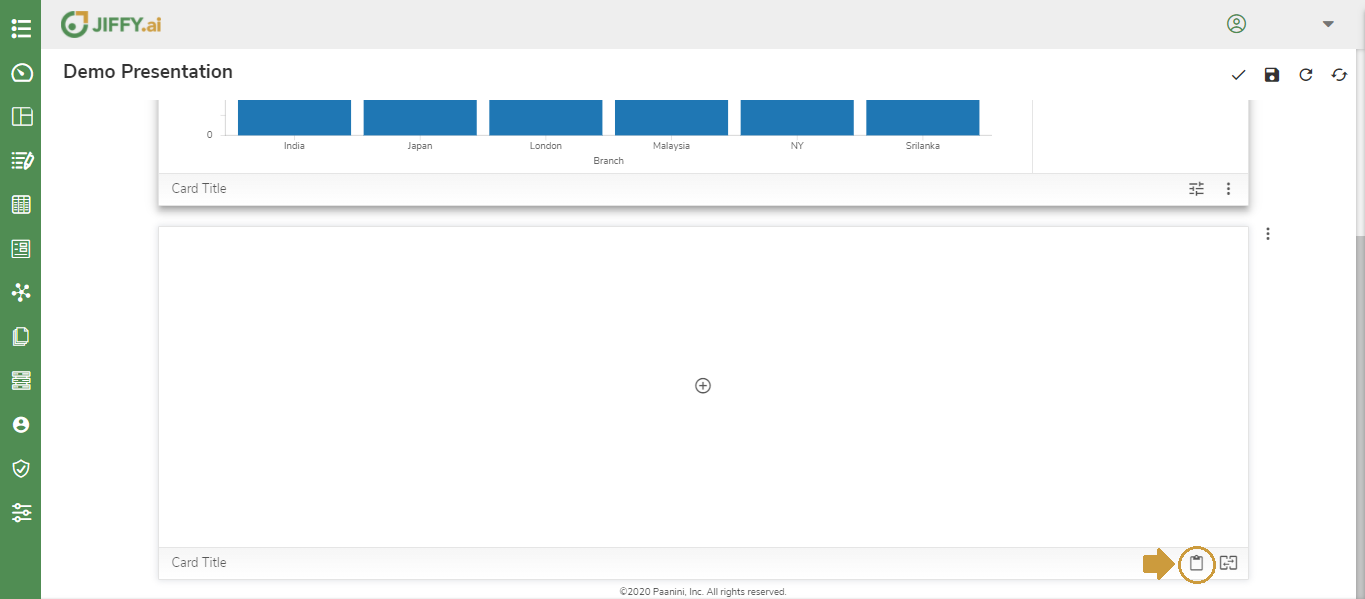
If the card is blank, instead of Unpick option Paste option will be shown.
Click on the Pick option to pick.
Below card is blank
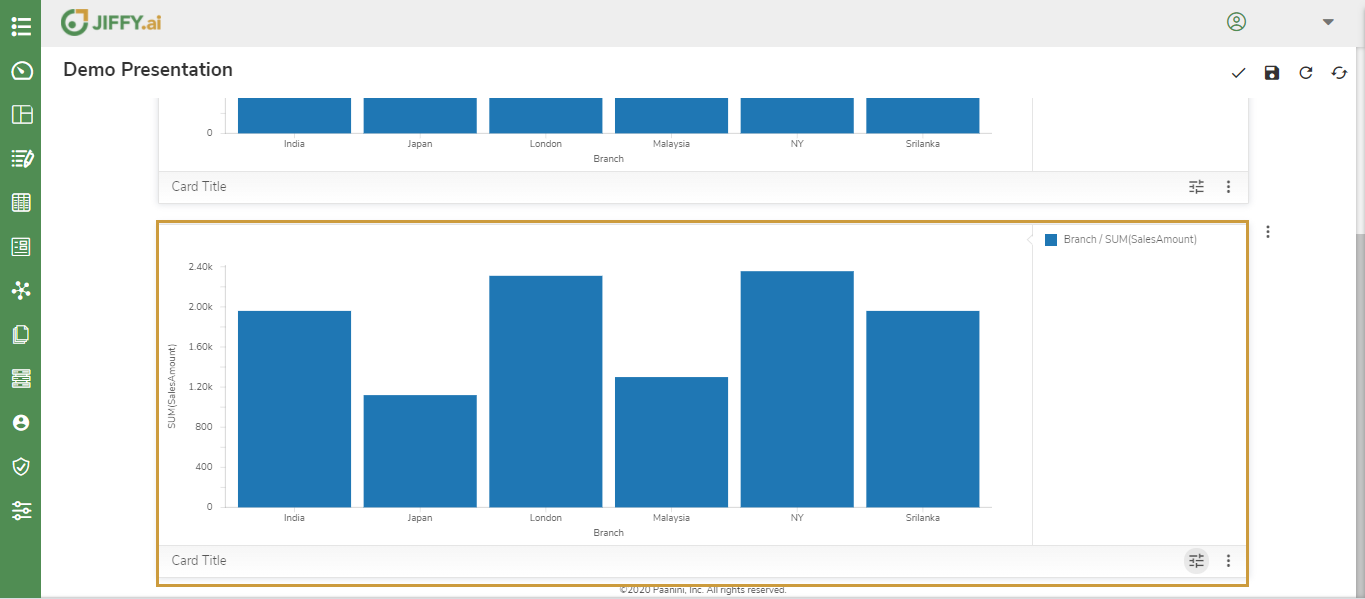
Click on the Paste option to Paste the card.
In the below screen,the card is pasted.
Using this feature, the user can clear the card.