The Audit log provides insight into the activities that are performed on the system. It provides the options to monitor the activities and evaluate in case of security incidents.
All the logs corresponding to the server components are streamed to fluentD. FluentD picks up the audit logs from the predefined location and writes them to Elasticsearch. Details of the audit log are viewed through Kibana Dashboard.
Prerequisite: Ensure that Kibana and Elastic Search services are up and running.
Log in to Kibana
- Navigate to URL of the Kibana dashboard and enter login credentials.
Contact Admin for the URL and login credentials.
- Select Global Tenant.
Kibana dashboard opens.
View Jiffy Audit Log
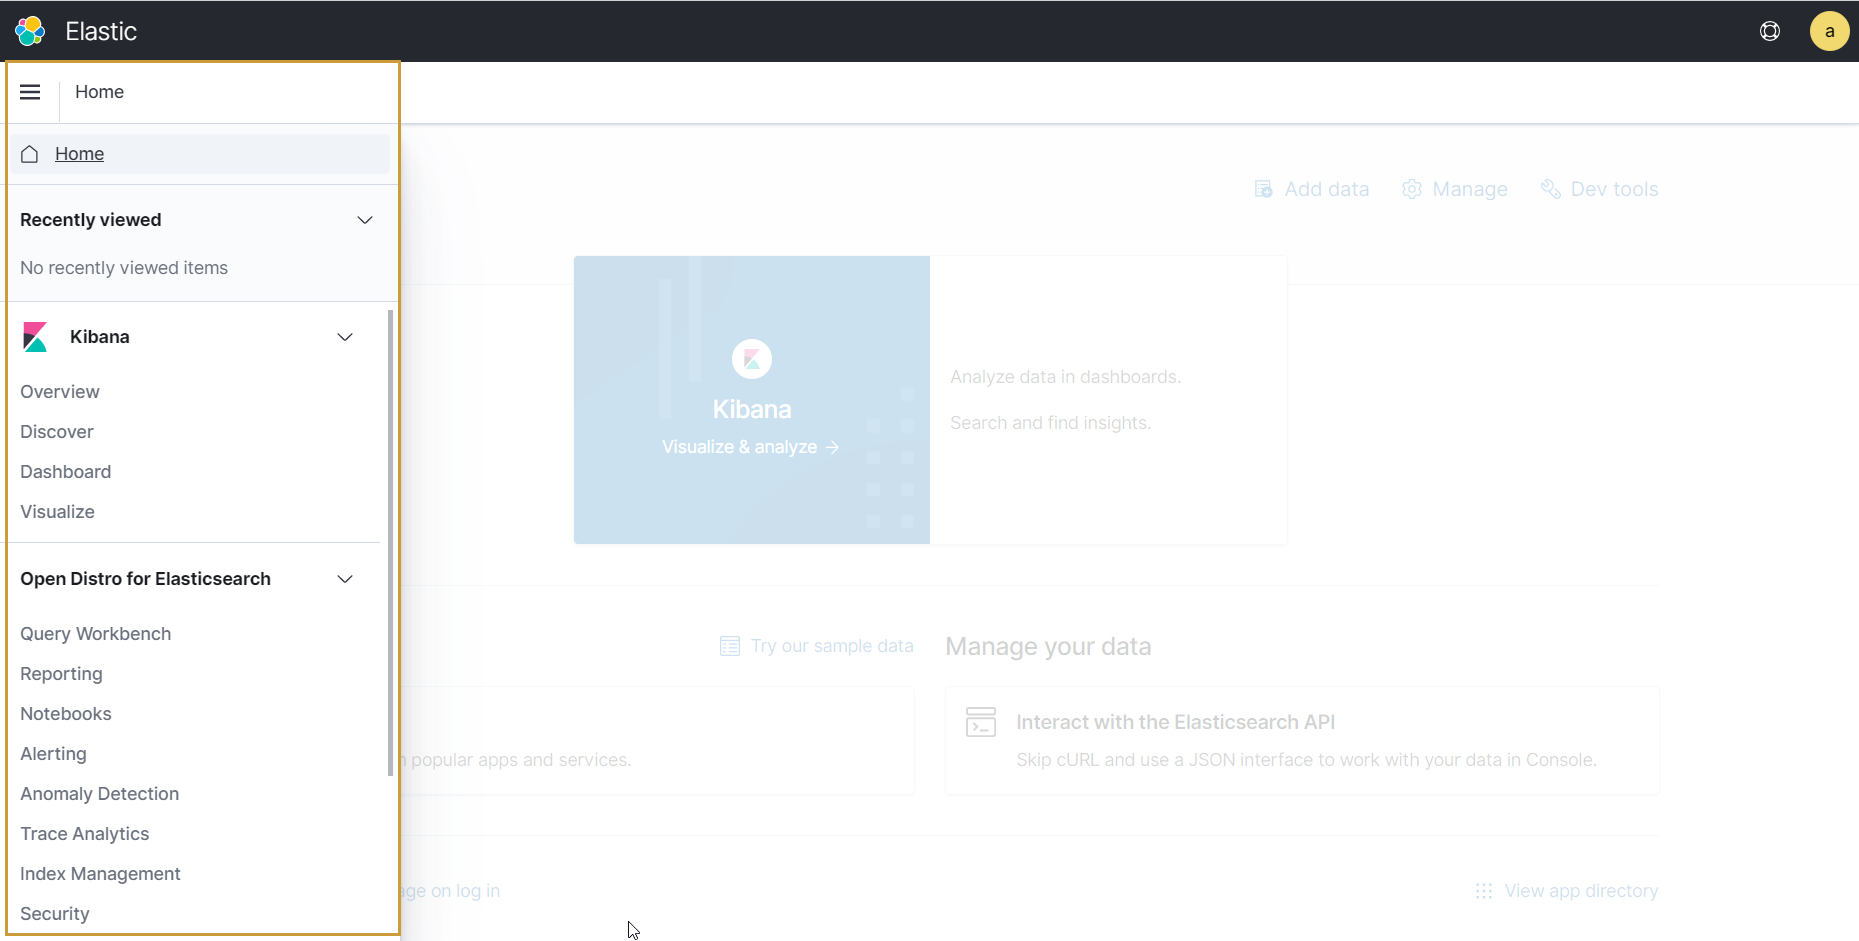
- Click the
 icon and navigate to the Discover option.
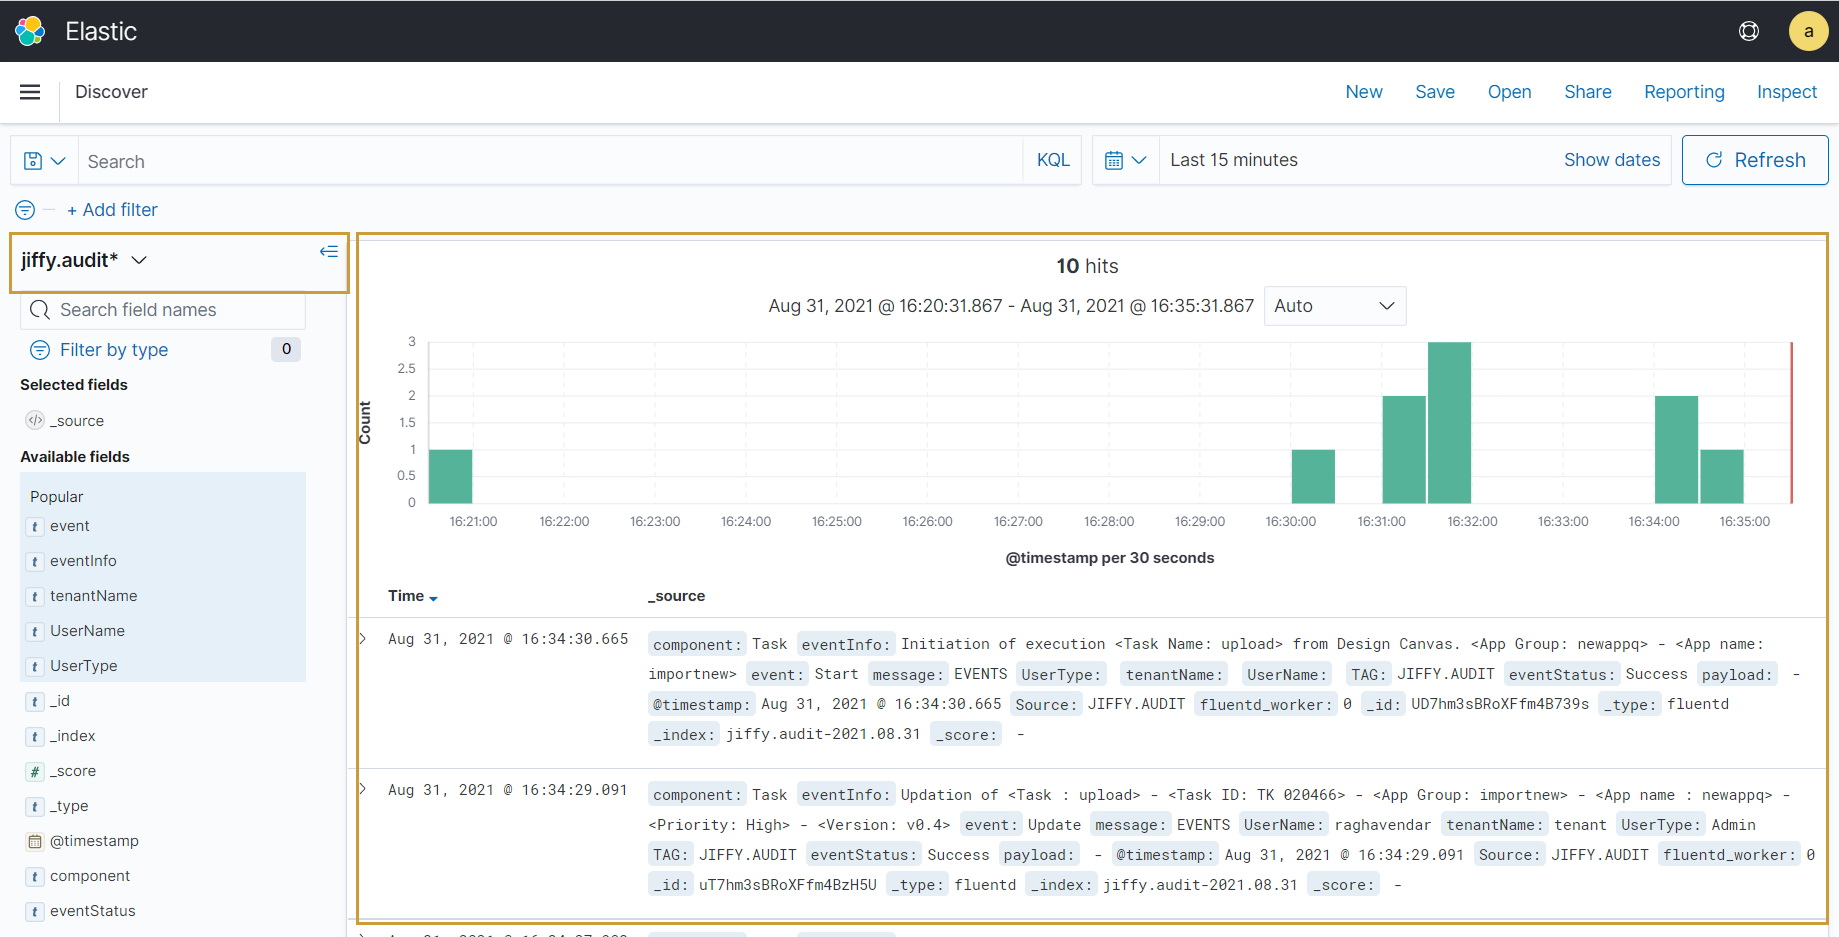
- Select jiffy.audit from the filter drop-down.
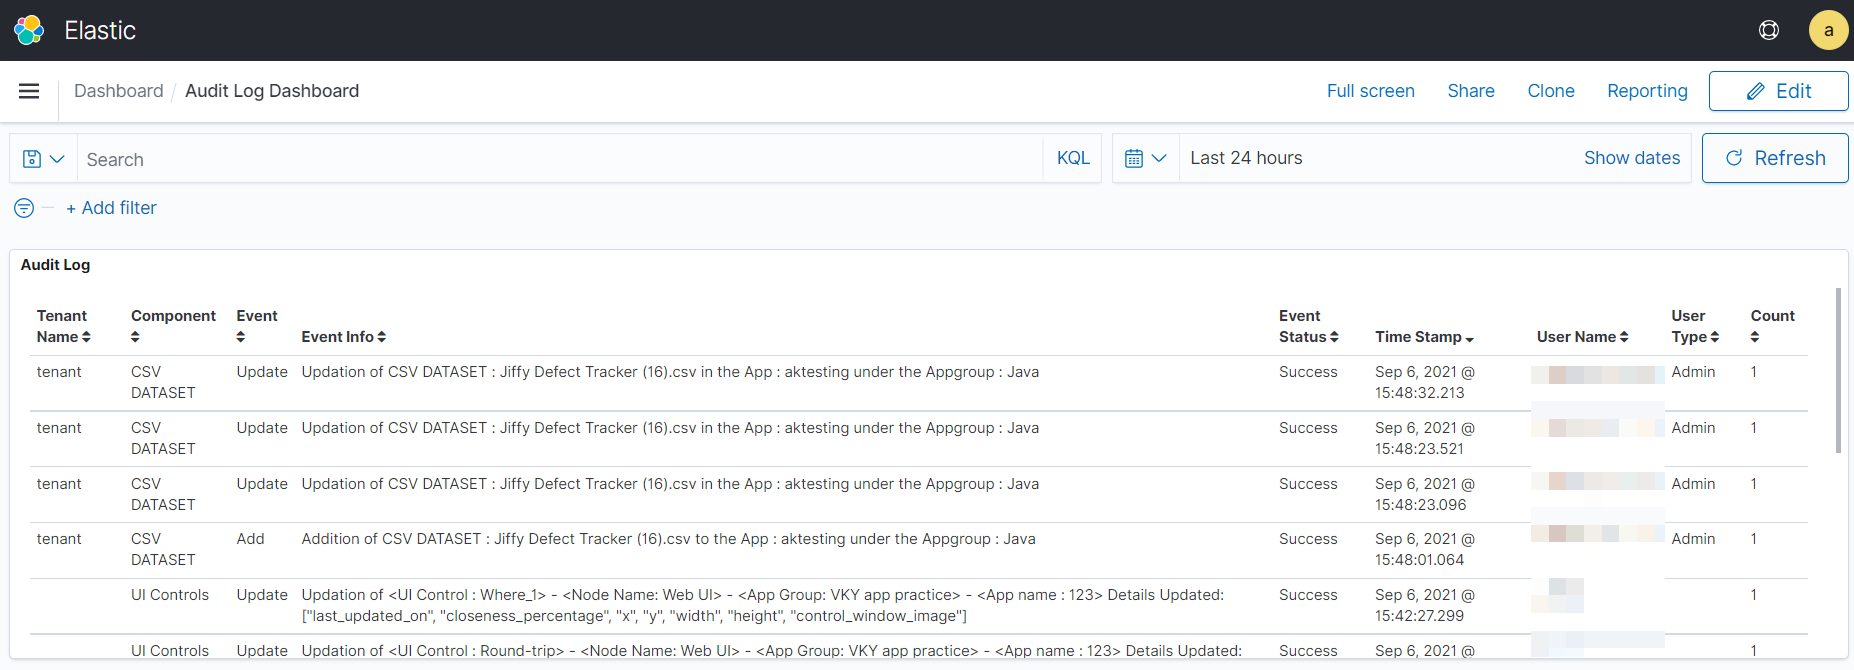
The following details are displayed for the activities that are performed.
- Tenant Name: Name of the Tenant
- Component: Component that is tracked, for example, Task.
- Event: Actions performed for the log, for example, Update, Start, etc.
- Event Info: Details of the action performed for the Component, for example, TaskID, App Group, App name, Version, etc.
- Event Status: Status of event, for example, Success or Failure.
- Time Stamp: Date and time of occurrence of the event
- UserName: Name of the user who performed the action. If the event was triggered by System, UserName gets displayed as System.
- User Type: Type of the user who performed the action.
If John Smith(Admin) is starting a Task, Component is Task, Event is Start, UserName is John Smith, and User Type is Admin.
Create Visualization
Audit Logs can be visualized in different formats, for example, Data Table, Gantt Chart, Horizontal Bar, etc.
- Click the icon and select the Visualize option.
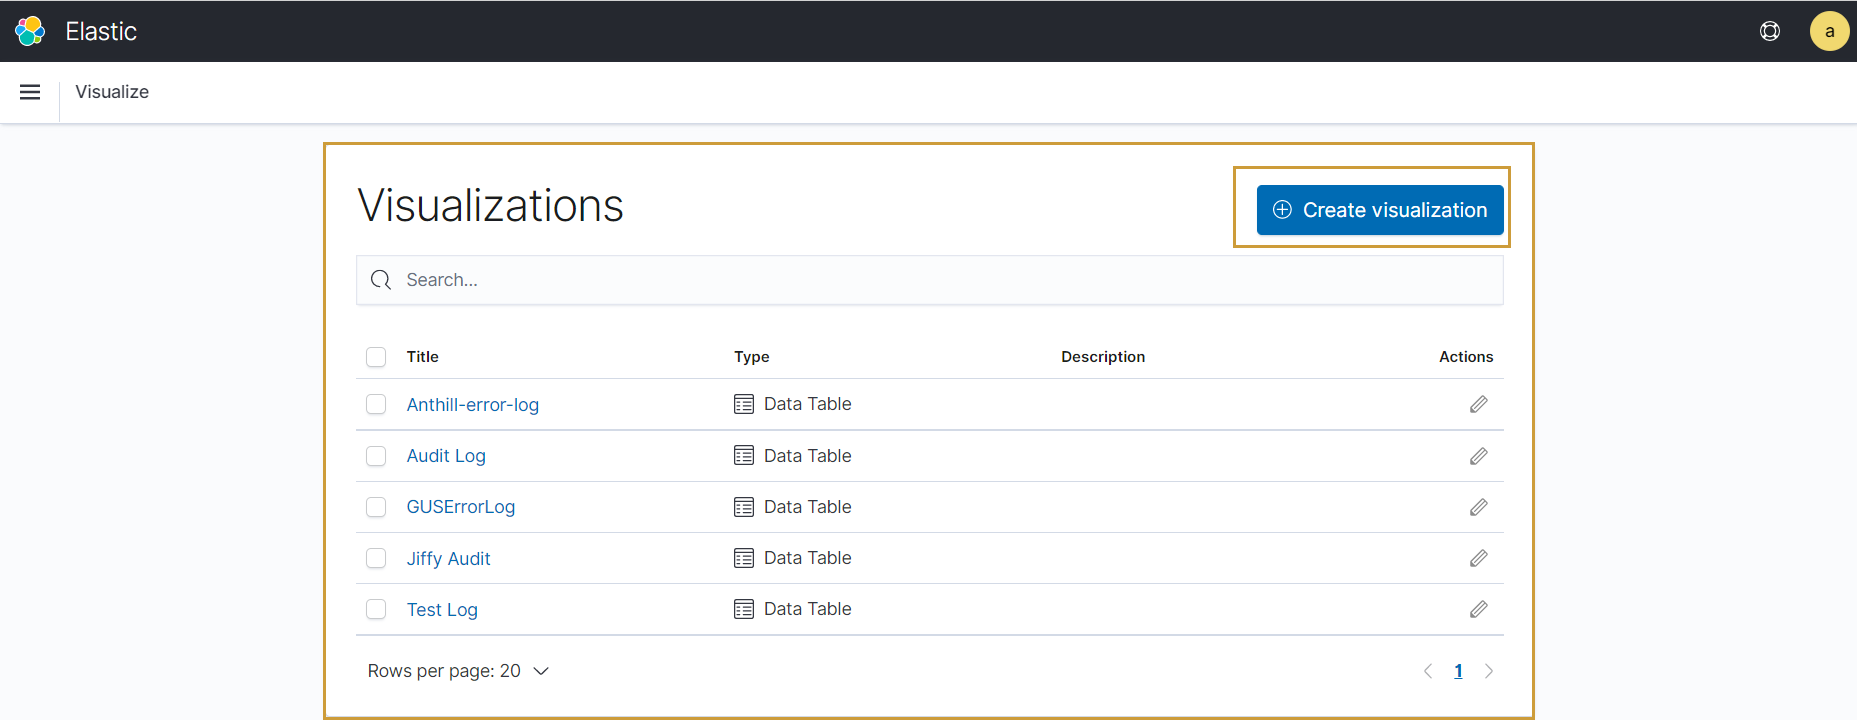
- Click the Create Visualization button.
- Select the Visualization Type, for example, Data Table.
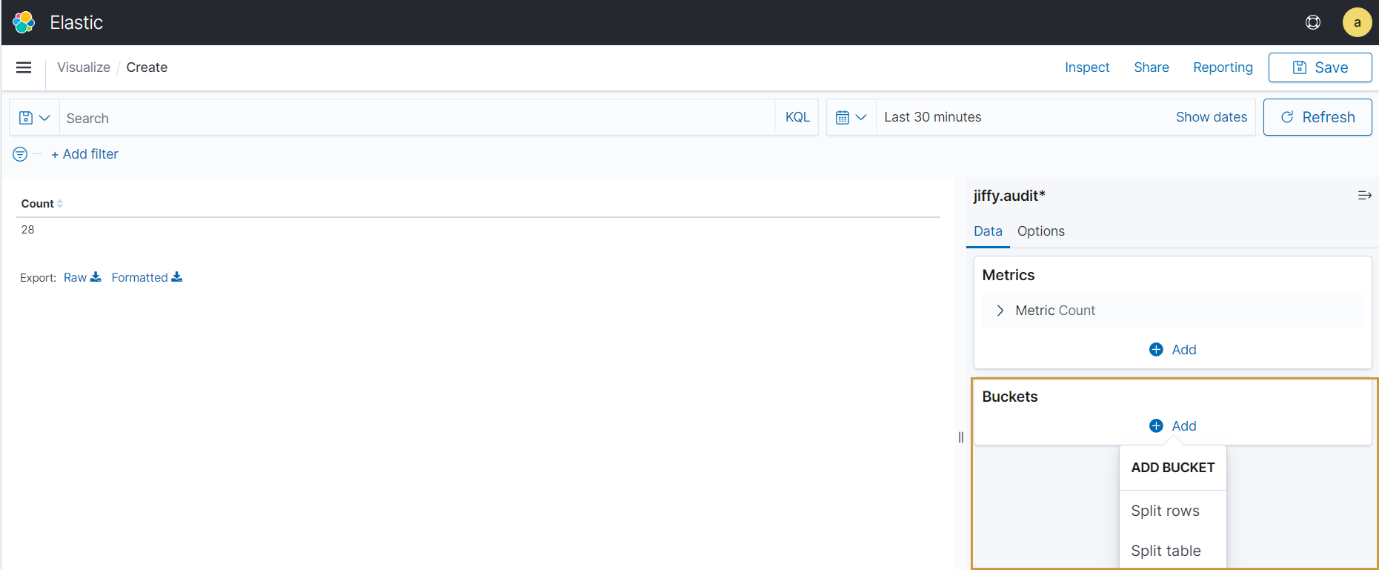
- Choose the source as jiffy.audit. Create Visualization page opens.
- Click the Add button from the Buckets.
- Select Split Rows option from the Buckets drop-down.
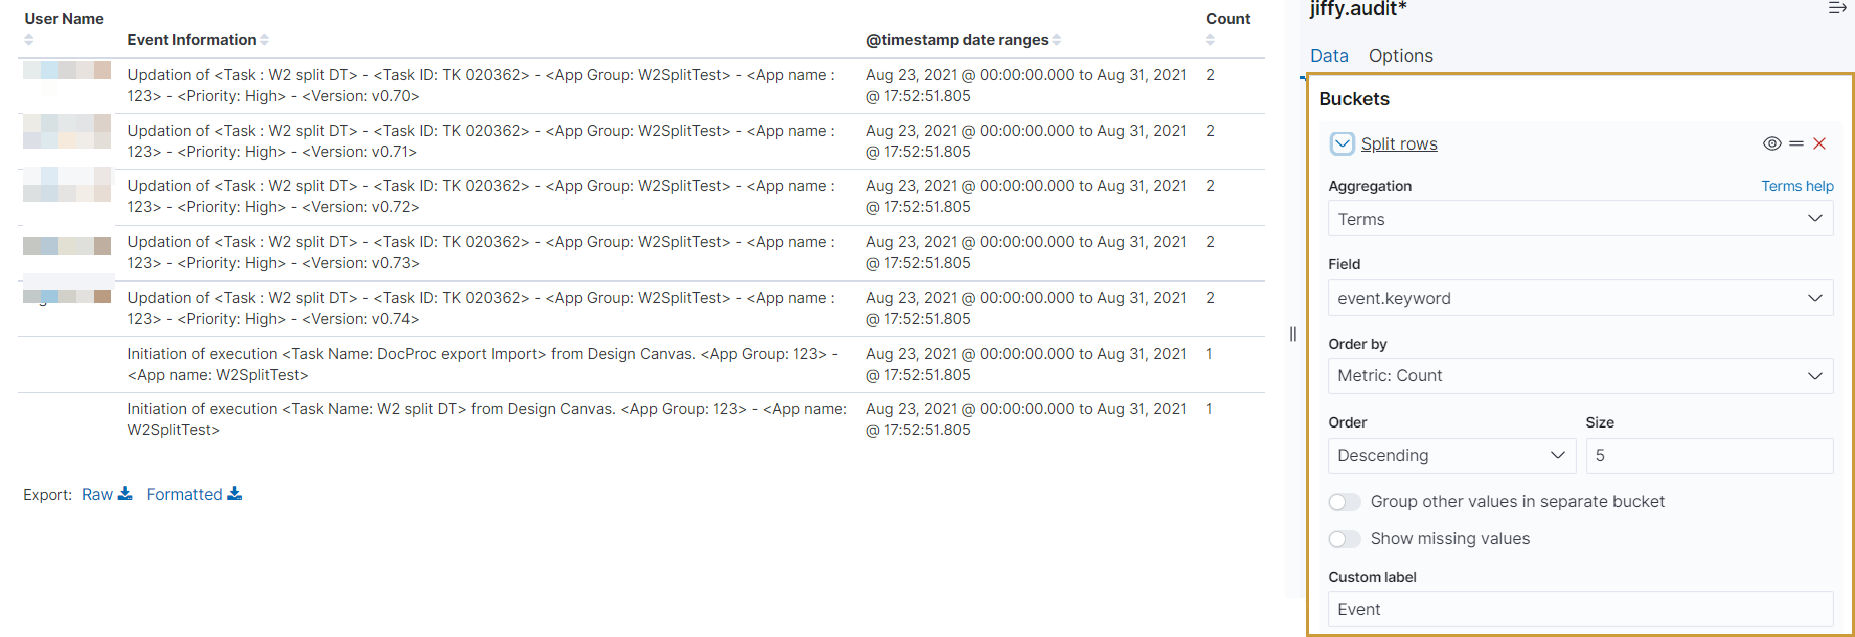
- Select Terms from the Aggregation drop-down.
- Select the field to be displayed in the visualization, for example, select eventinfo.keyword to display Event Info.
- Click the Update button and add more fields.
- Click the Save button.
All the visualizations created are listed in the Visualization page.
Create dashboard
- Click the icon and select the Dashboard option.
- Click the Create Dashboard button.
- Add an existing or new object to this dashboard.
All the dashboards created are listed in the Dashboard page.
You can click and view the required Dashboard.

.png)
.png) Kibana dashboard opens.
Kibana dashboard opens.