Create Dashboard
- Click the
 icon and select the Dashboard option.
- Click the Create Dashboard button.
- Add an existing or new object to this dashboard.
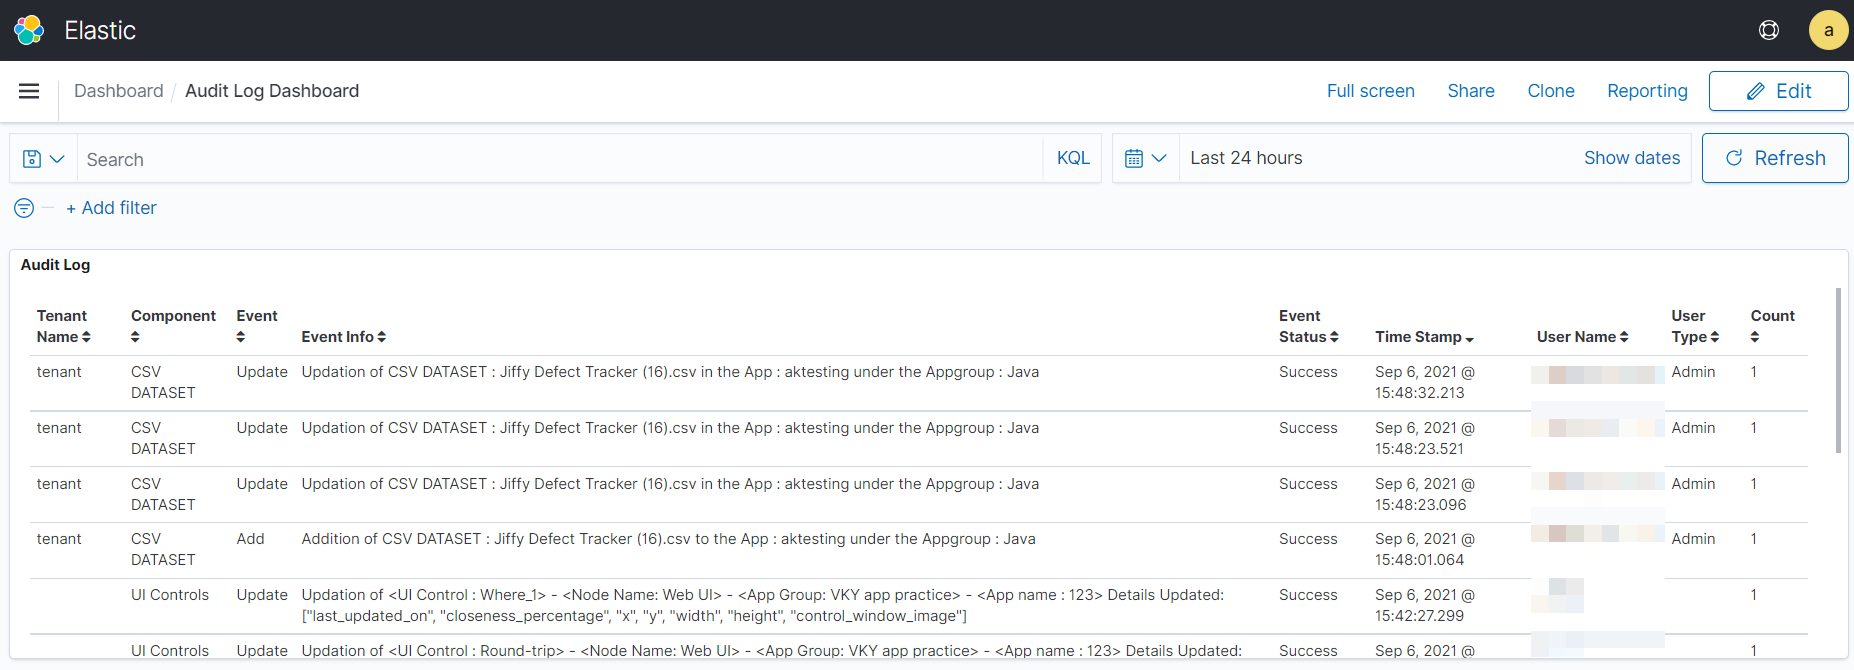
All the dashboards created are listed in the Dashboard page.
You can click and view the required Dashboard.
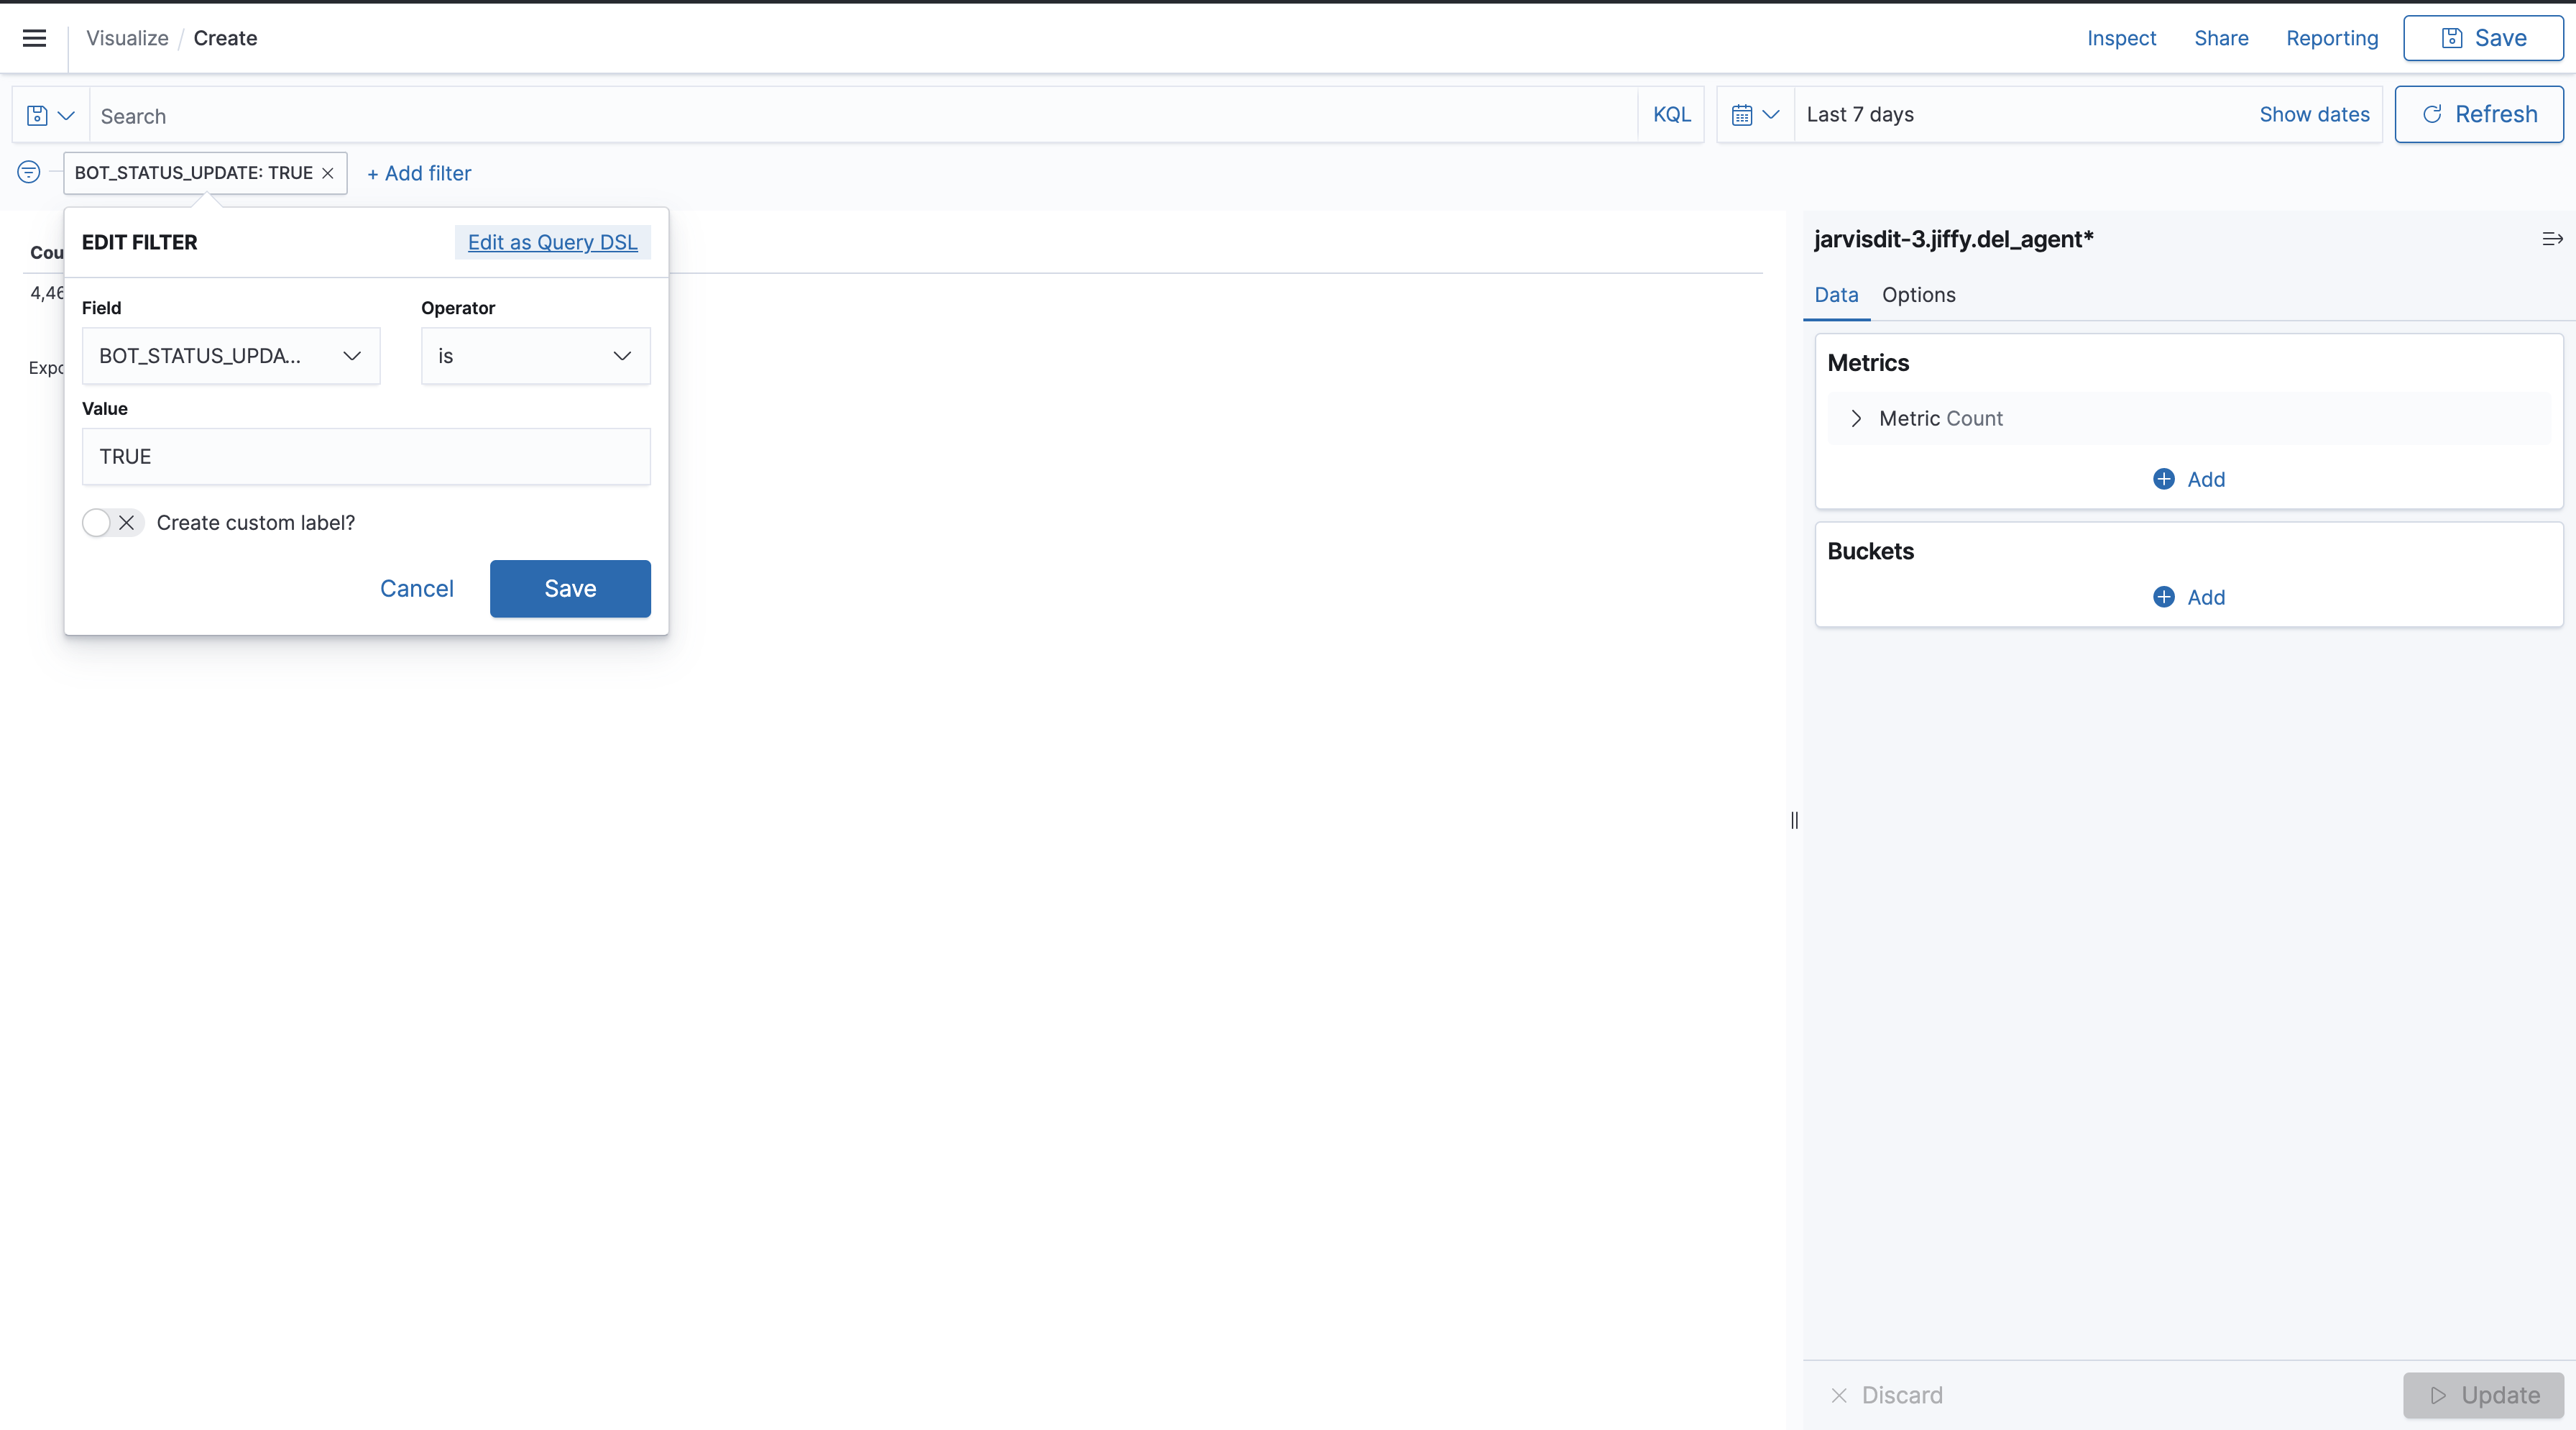
Add Filters
- Click the +Add filter option.
- Select the field and Operator in the EDIT FILTER field.
Create Visualization
Audit Logs can be visualized in different formats, for example, Data Table, Gantt Chart, Horizontal Bar, etc.
- Click the icon and select the Visualize option.
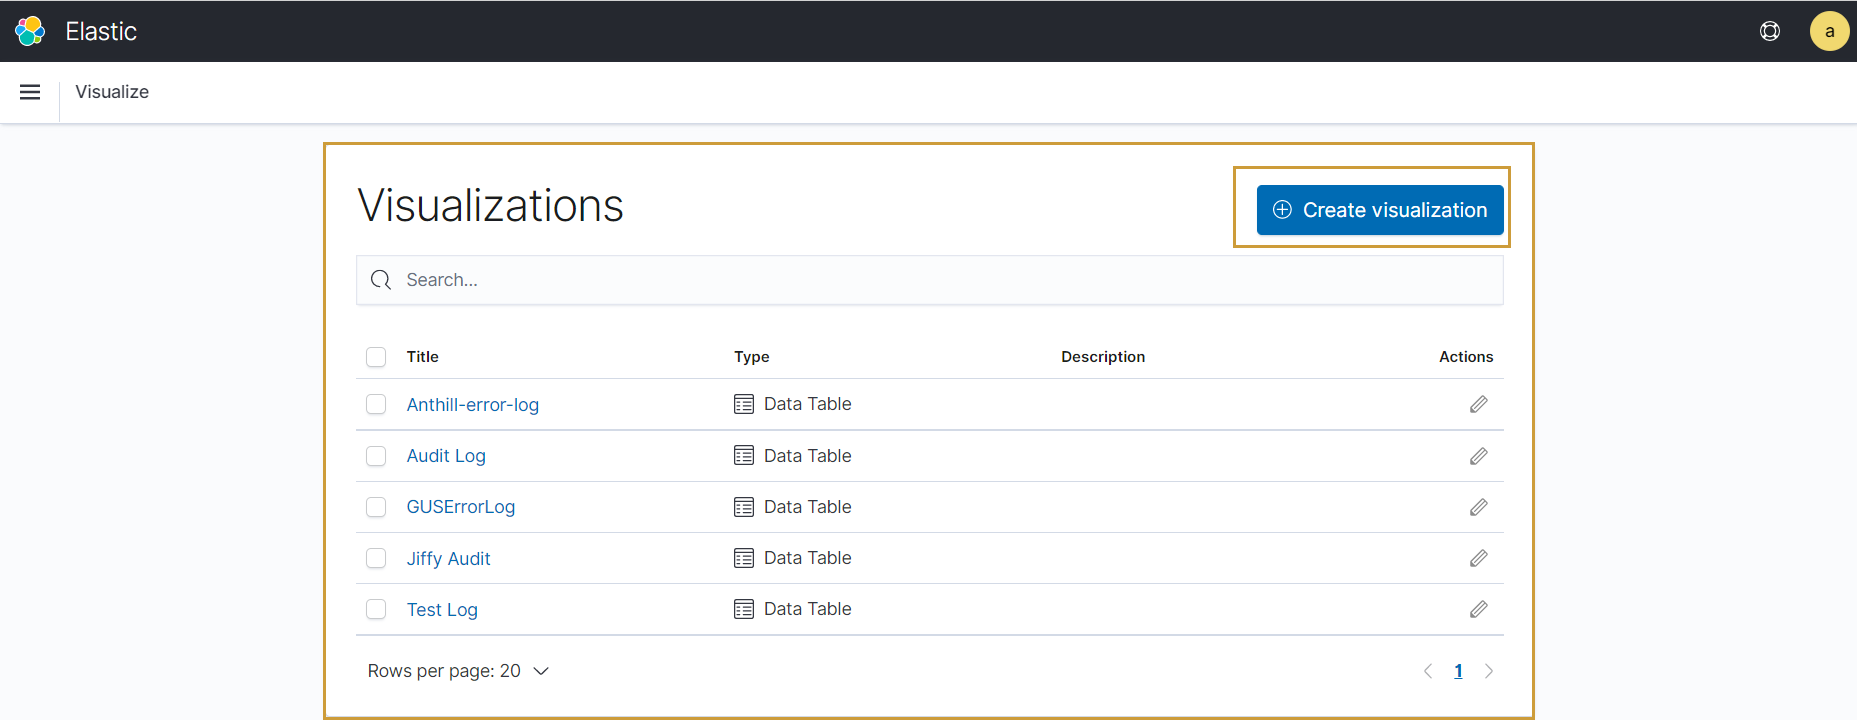
- Click the Create Visualization button.
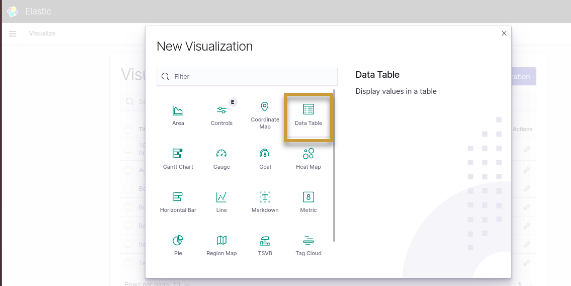
- Select the Visualization Type, for example, Data Table.
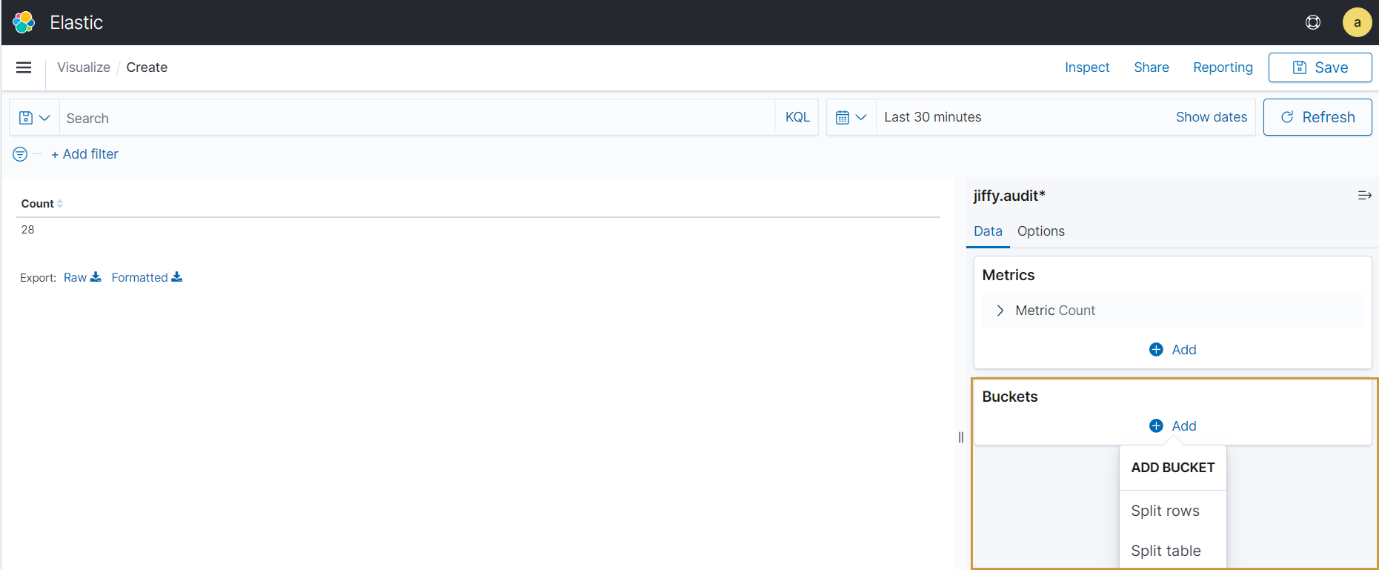
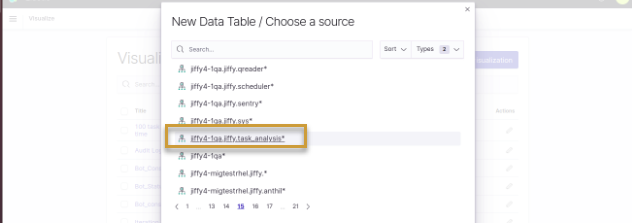
- Choose the source as jiffy.audit. Create Visualization page opens.
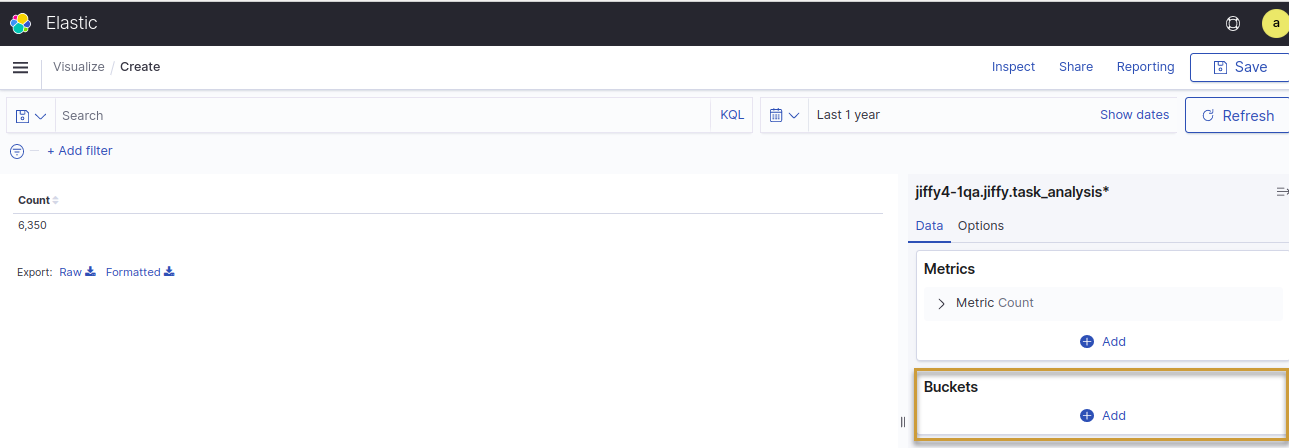
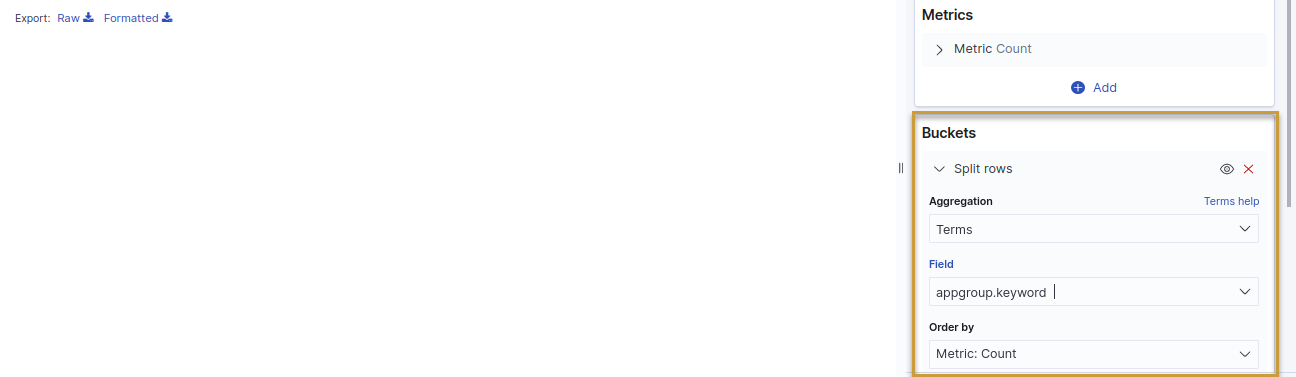
- Click the Add button from the Buckets.
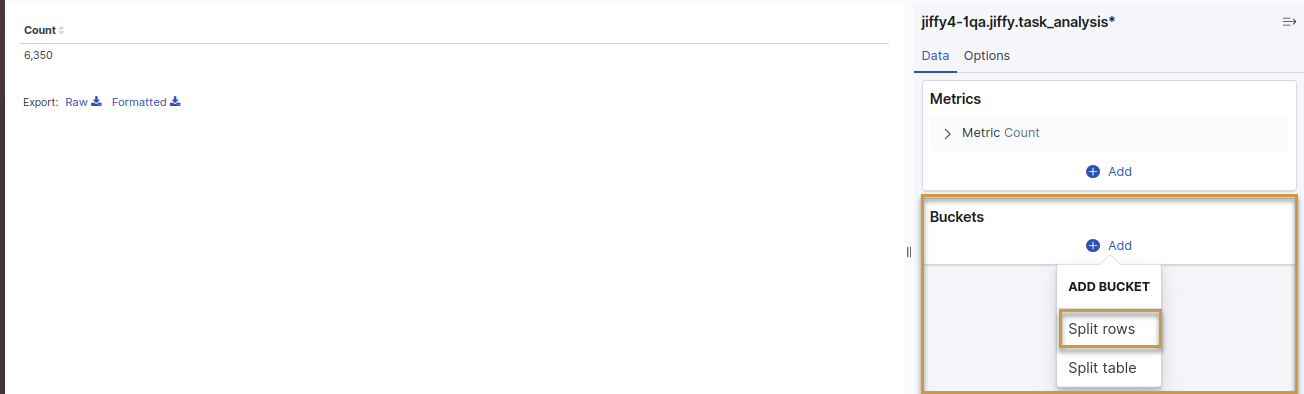
- Select Split Rows option from the Buckets drop-down.
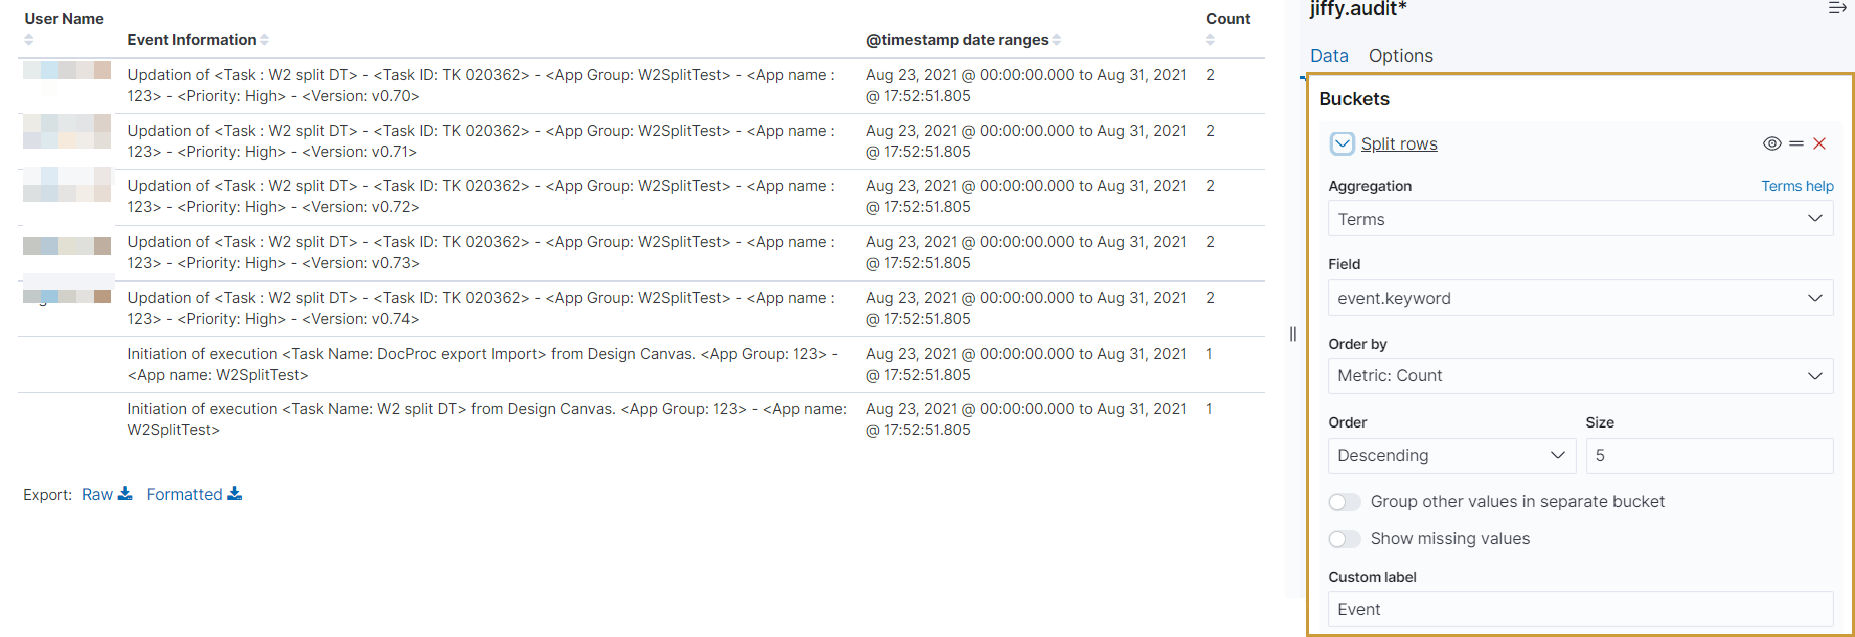
- Select Terms from the Aggregation drop-down.
- Select the field to be displayed in the visualization, for example, select eventinfo.keyword to display Event Info.
- Click the Update button and add more fields.
- Click the Save button.
All the visualizations created are listed in the Visualization page.
Create Visualization as “Data Table”
- Select a visualization type as “Data Table”.
- Select an index pattern from which data needs to be accessed.
- Add a bucket in visualization.
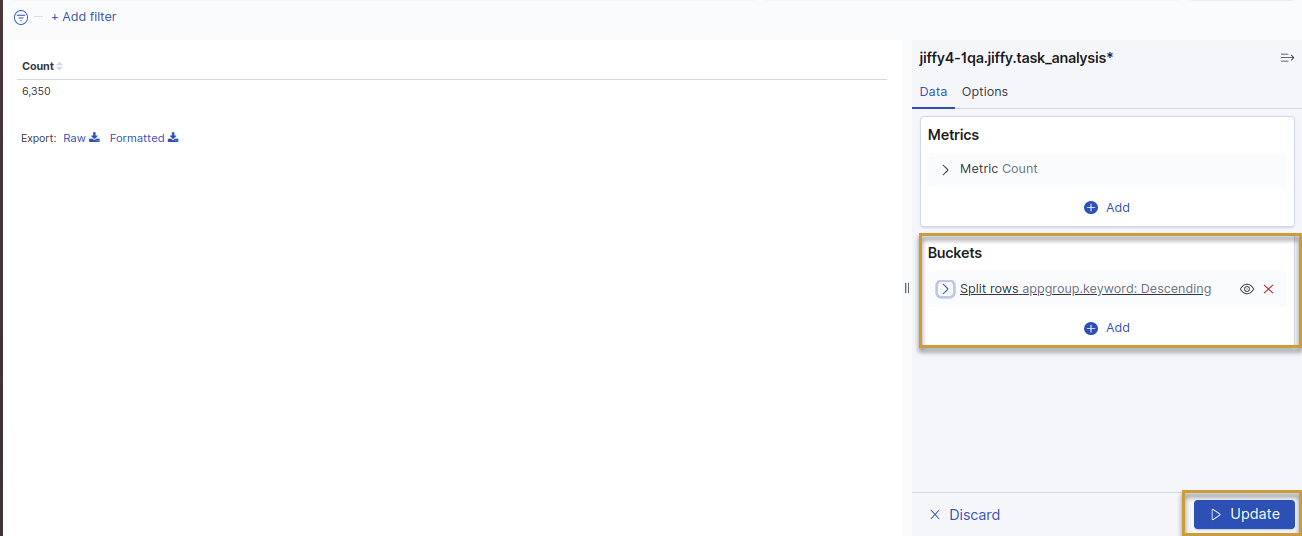
- Click the Add button under Buckets.
- Click the Split rows option.
- Select aggregation and field as shown below.
- Click on Add button to add more buckets and select aggregation and field in each bucket.
- Click the Update button and then click Save button.
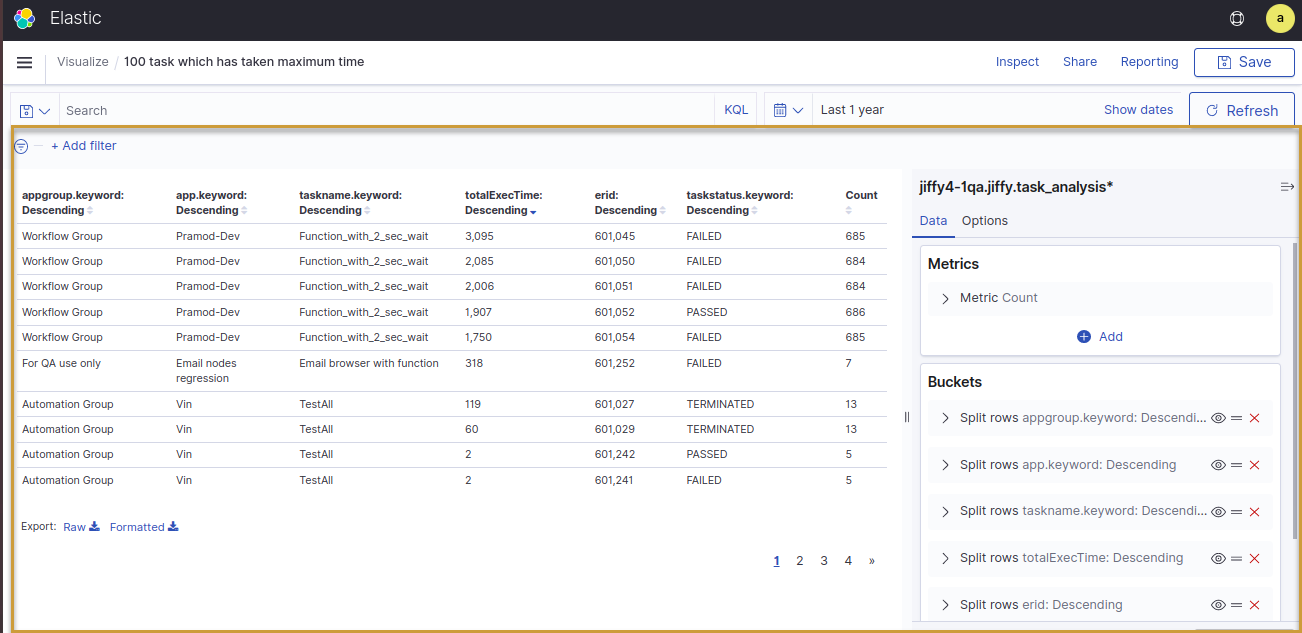
- The following example shows 100 task which has taken maximum time:
Create Index in Kibana
- Open the Stack Management.
- Click on the Create Index Patterns.
- Define the name of index with tenant Domain name as bot_task_log.
- Select the primary time field for index.
- Click on Create the index pattern.
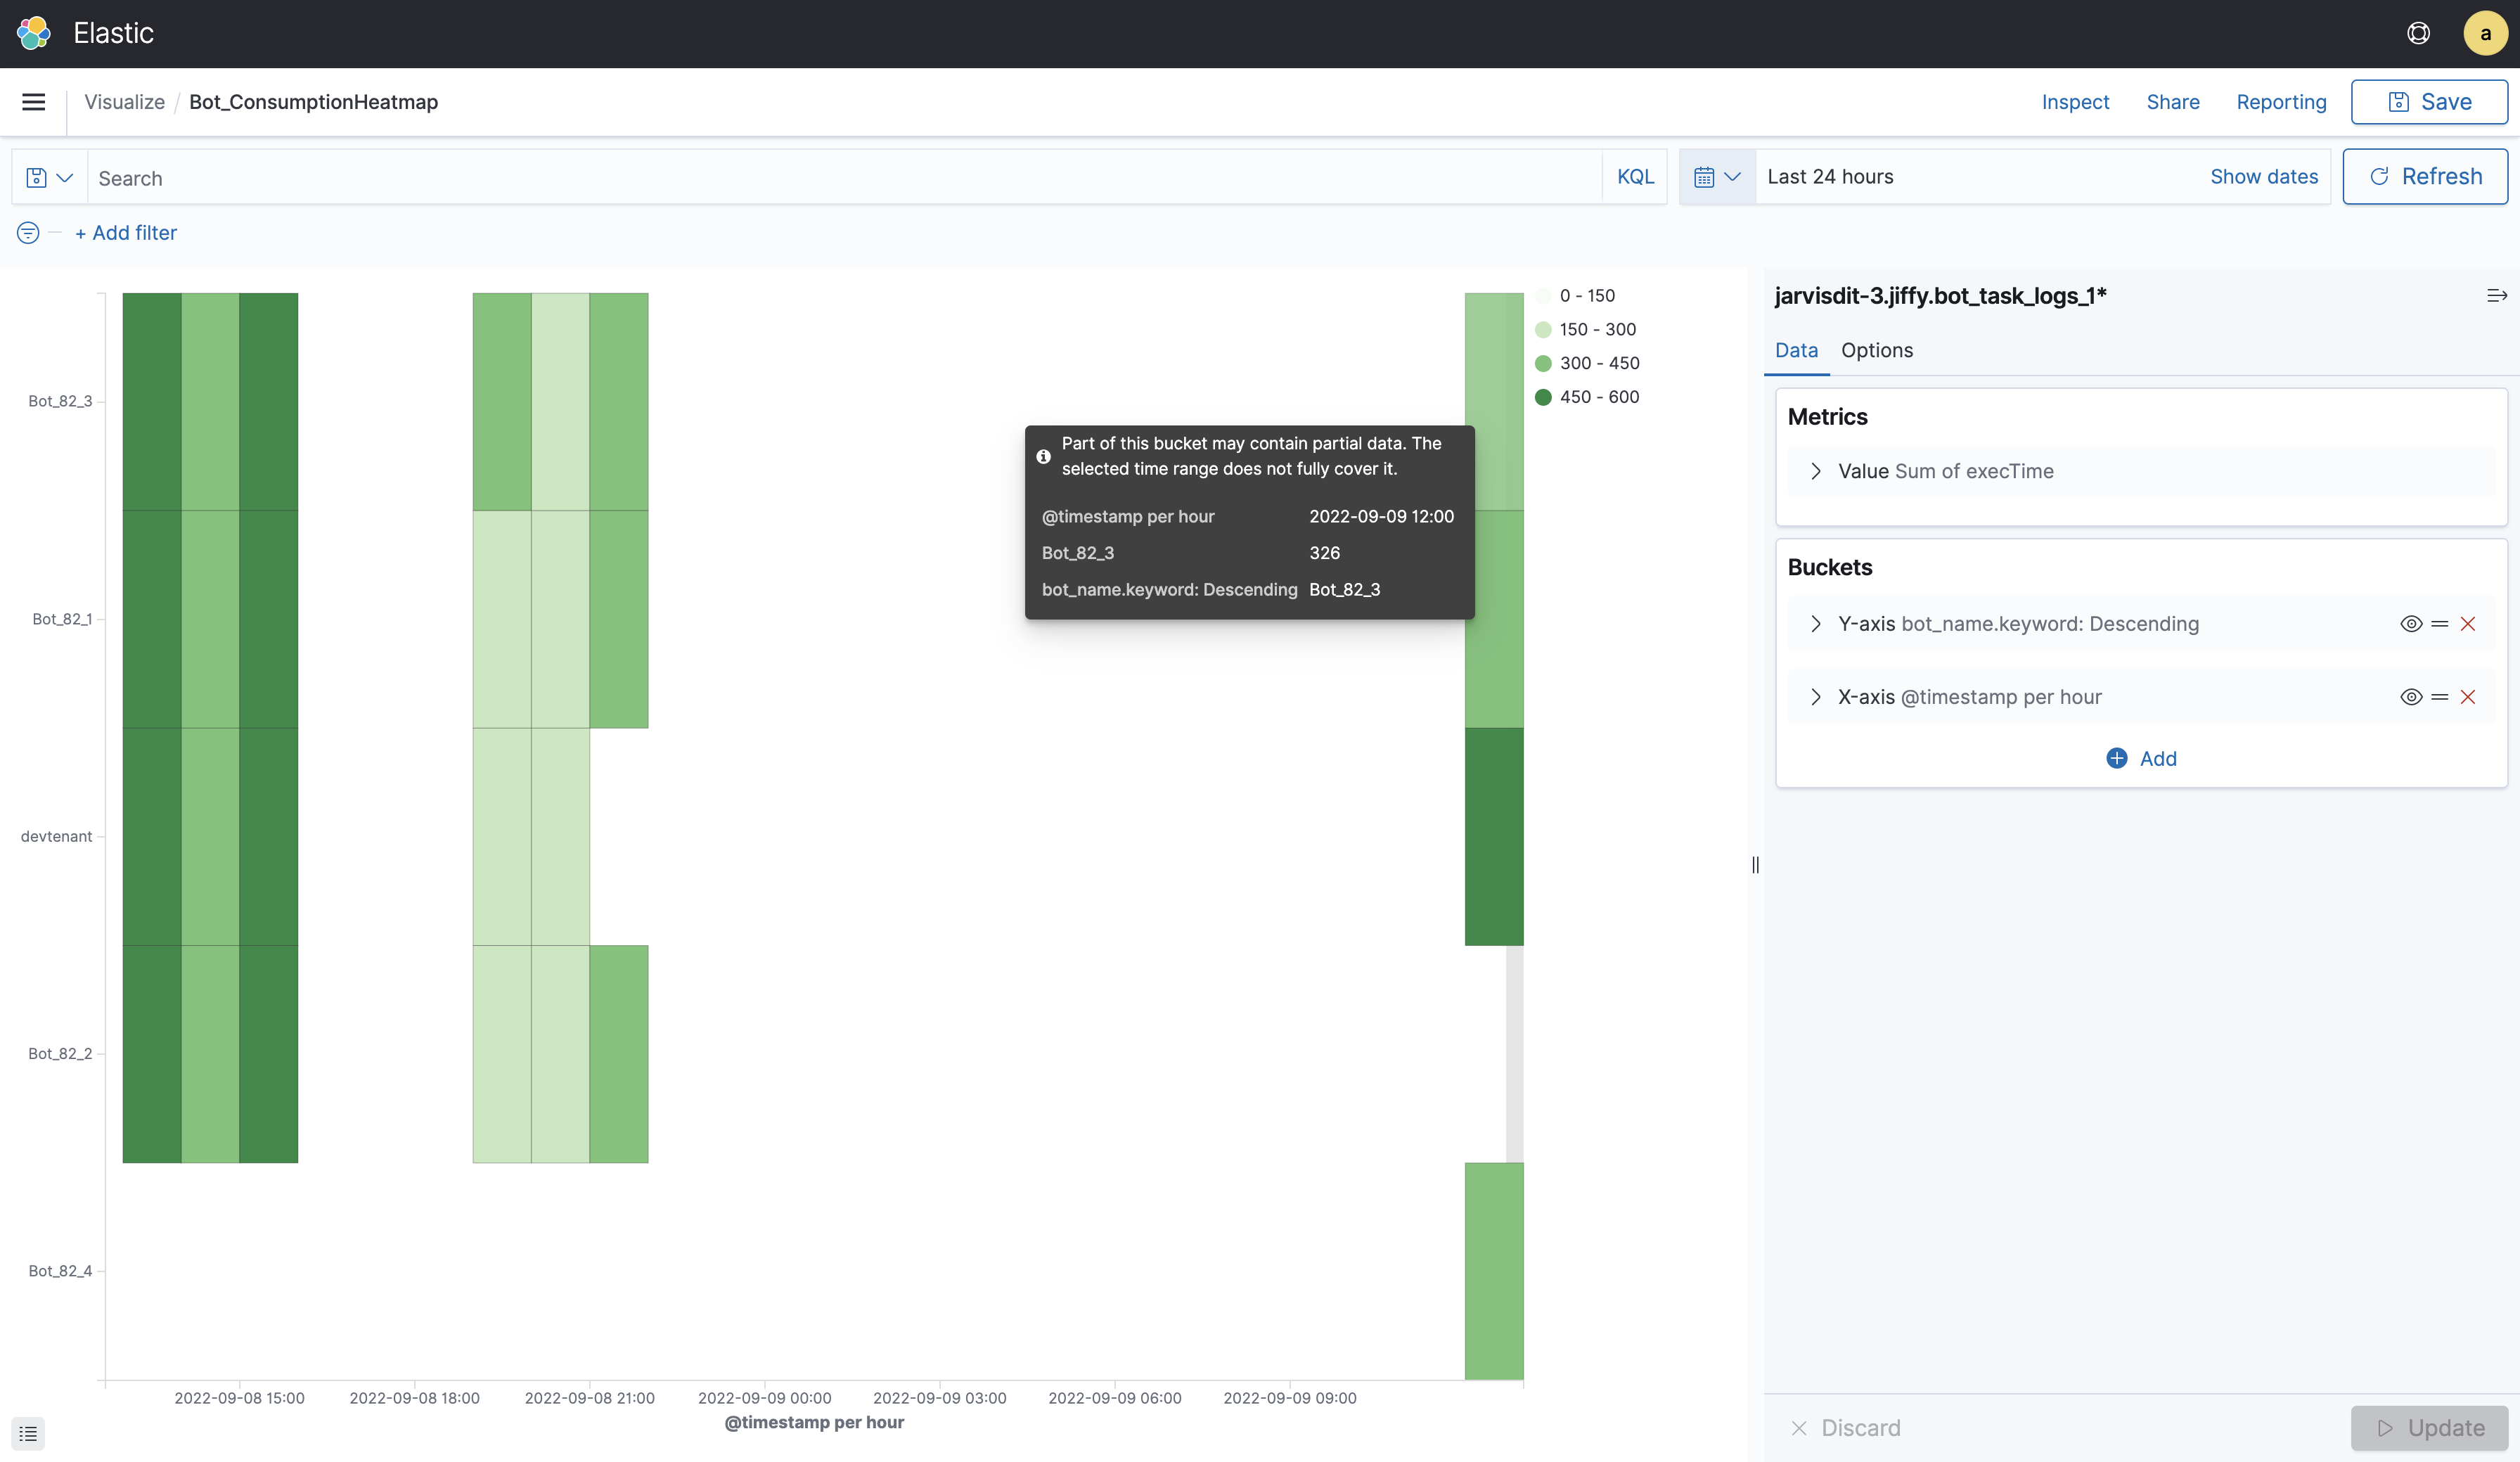
Bot Consumption HeatMap
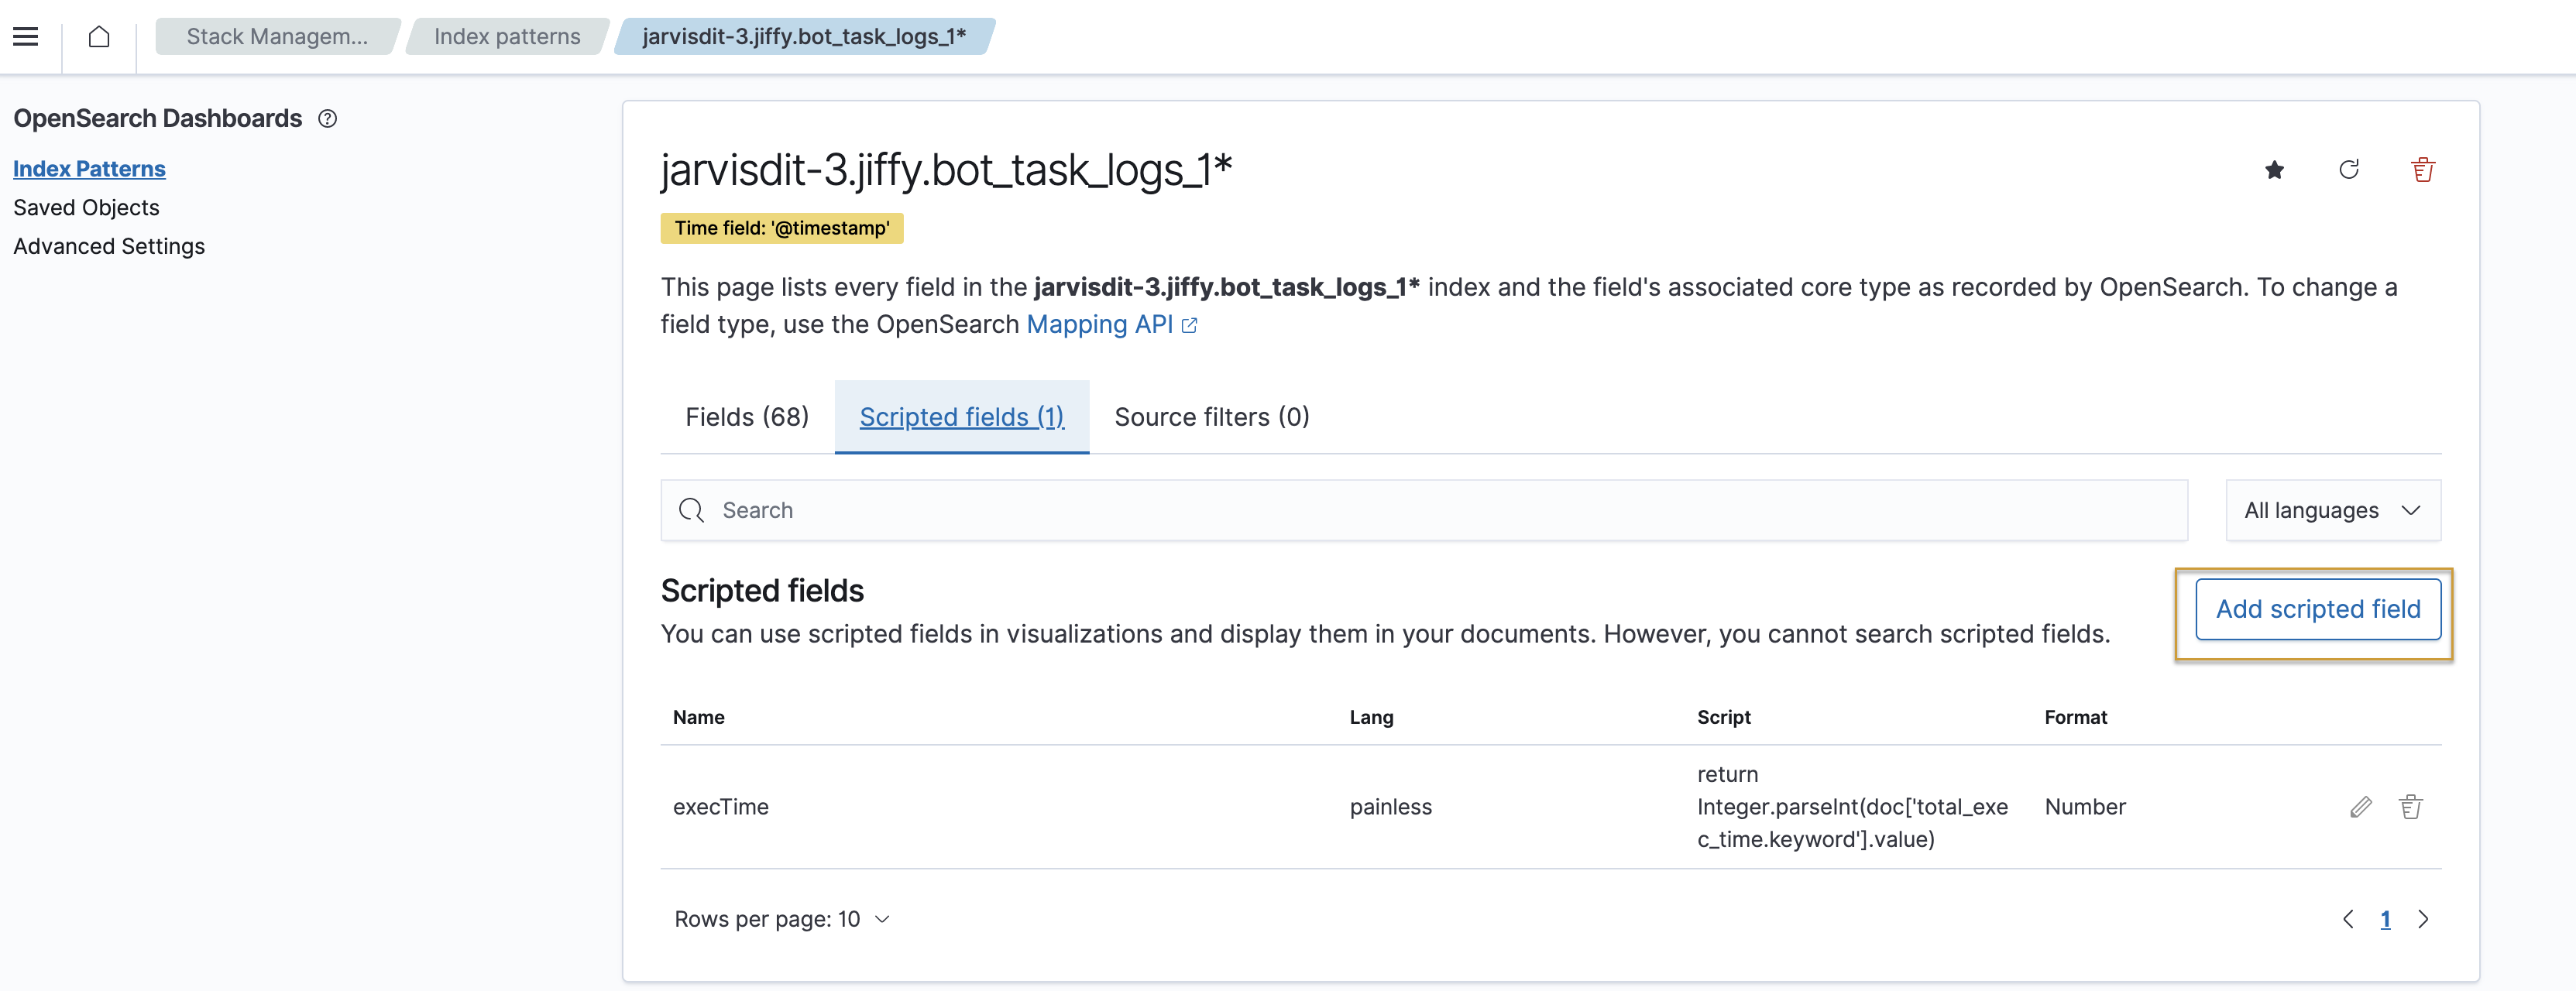
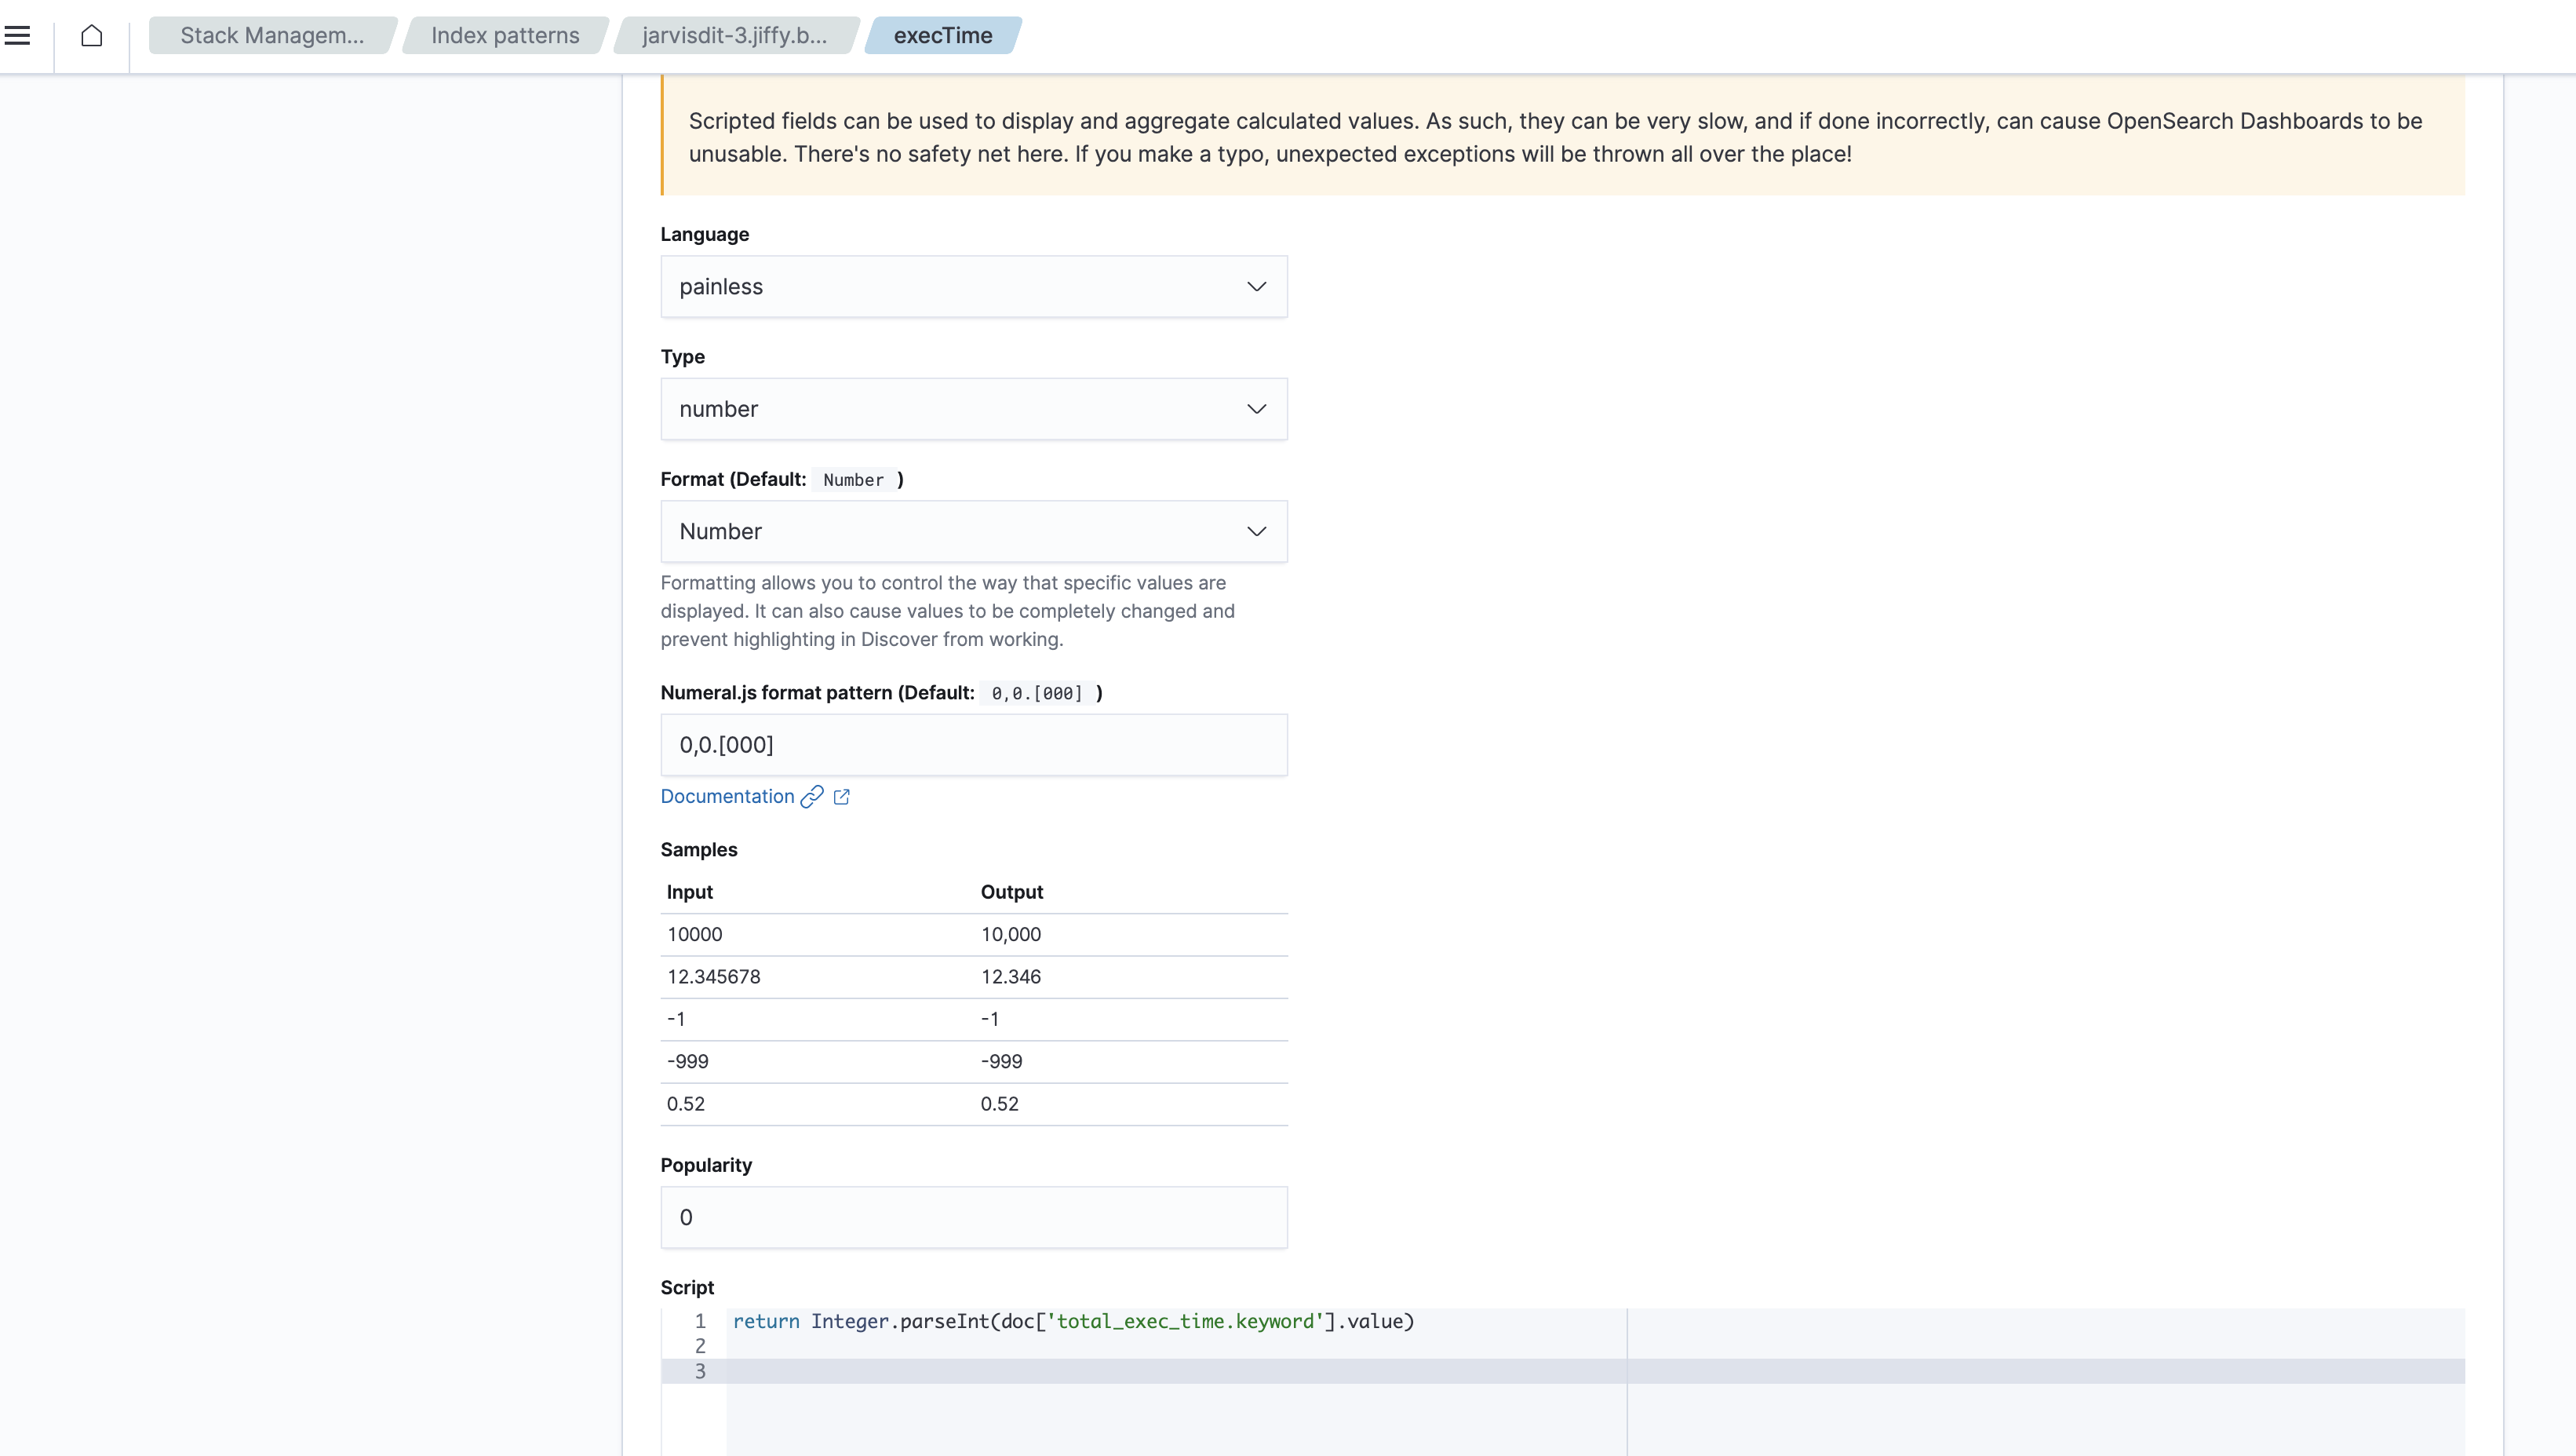
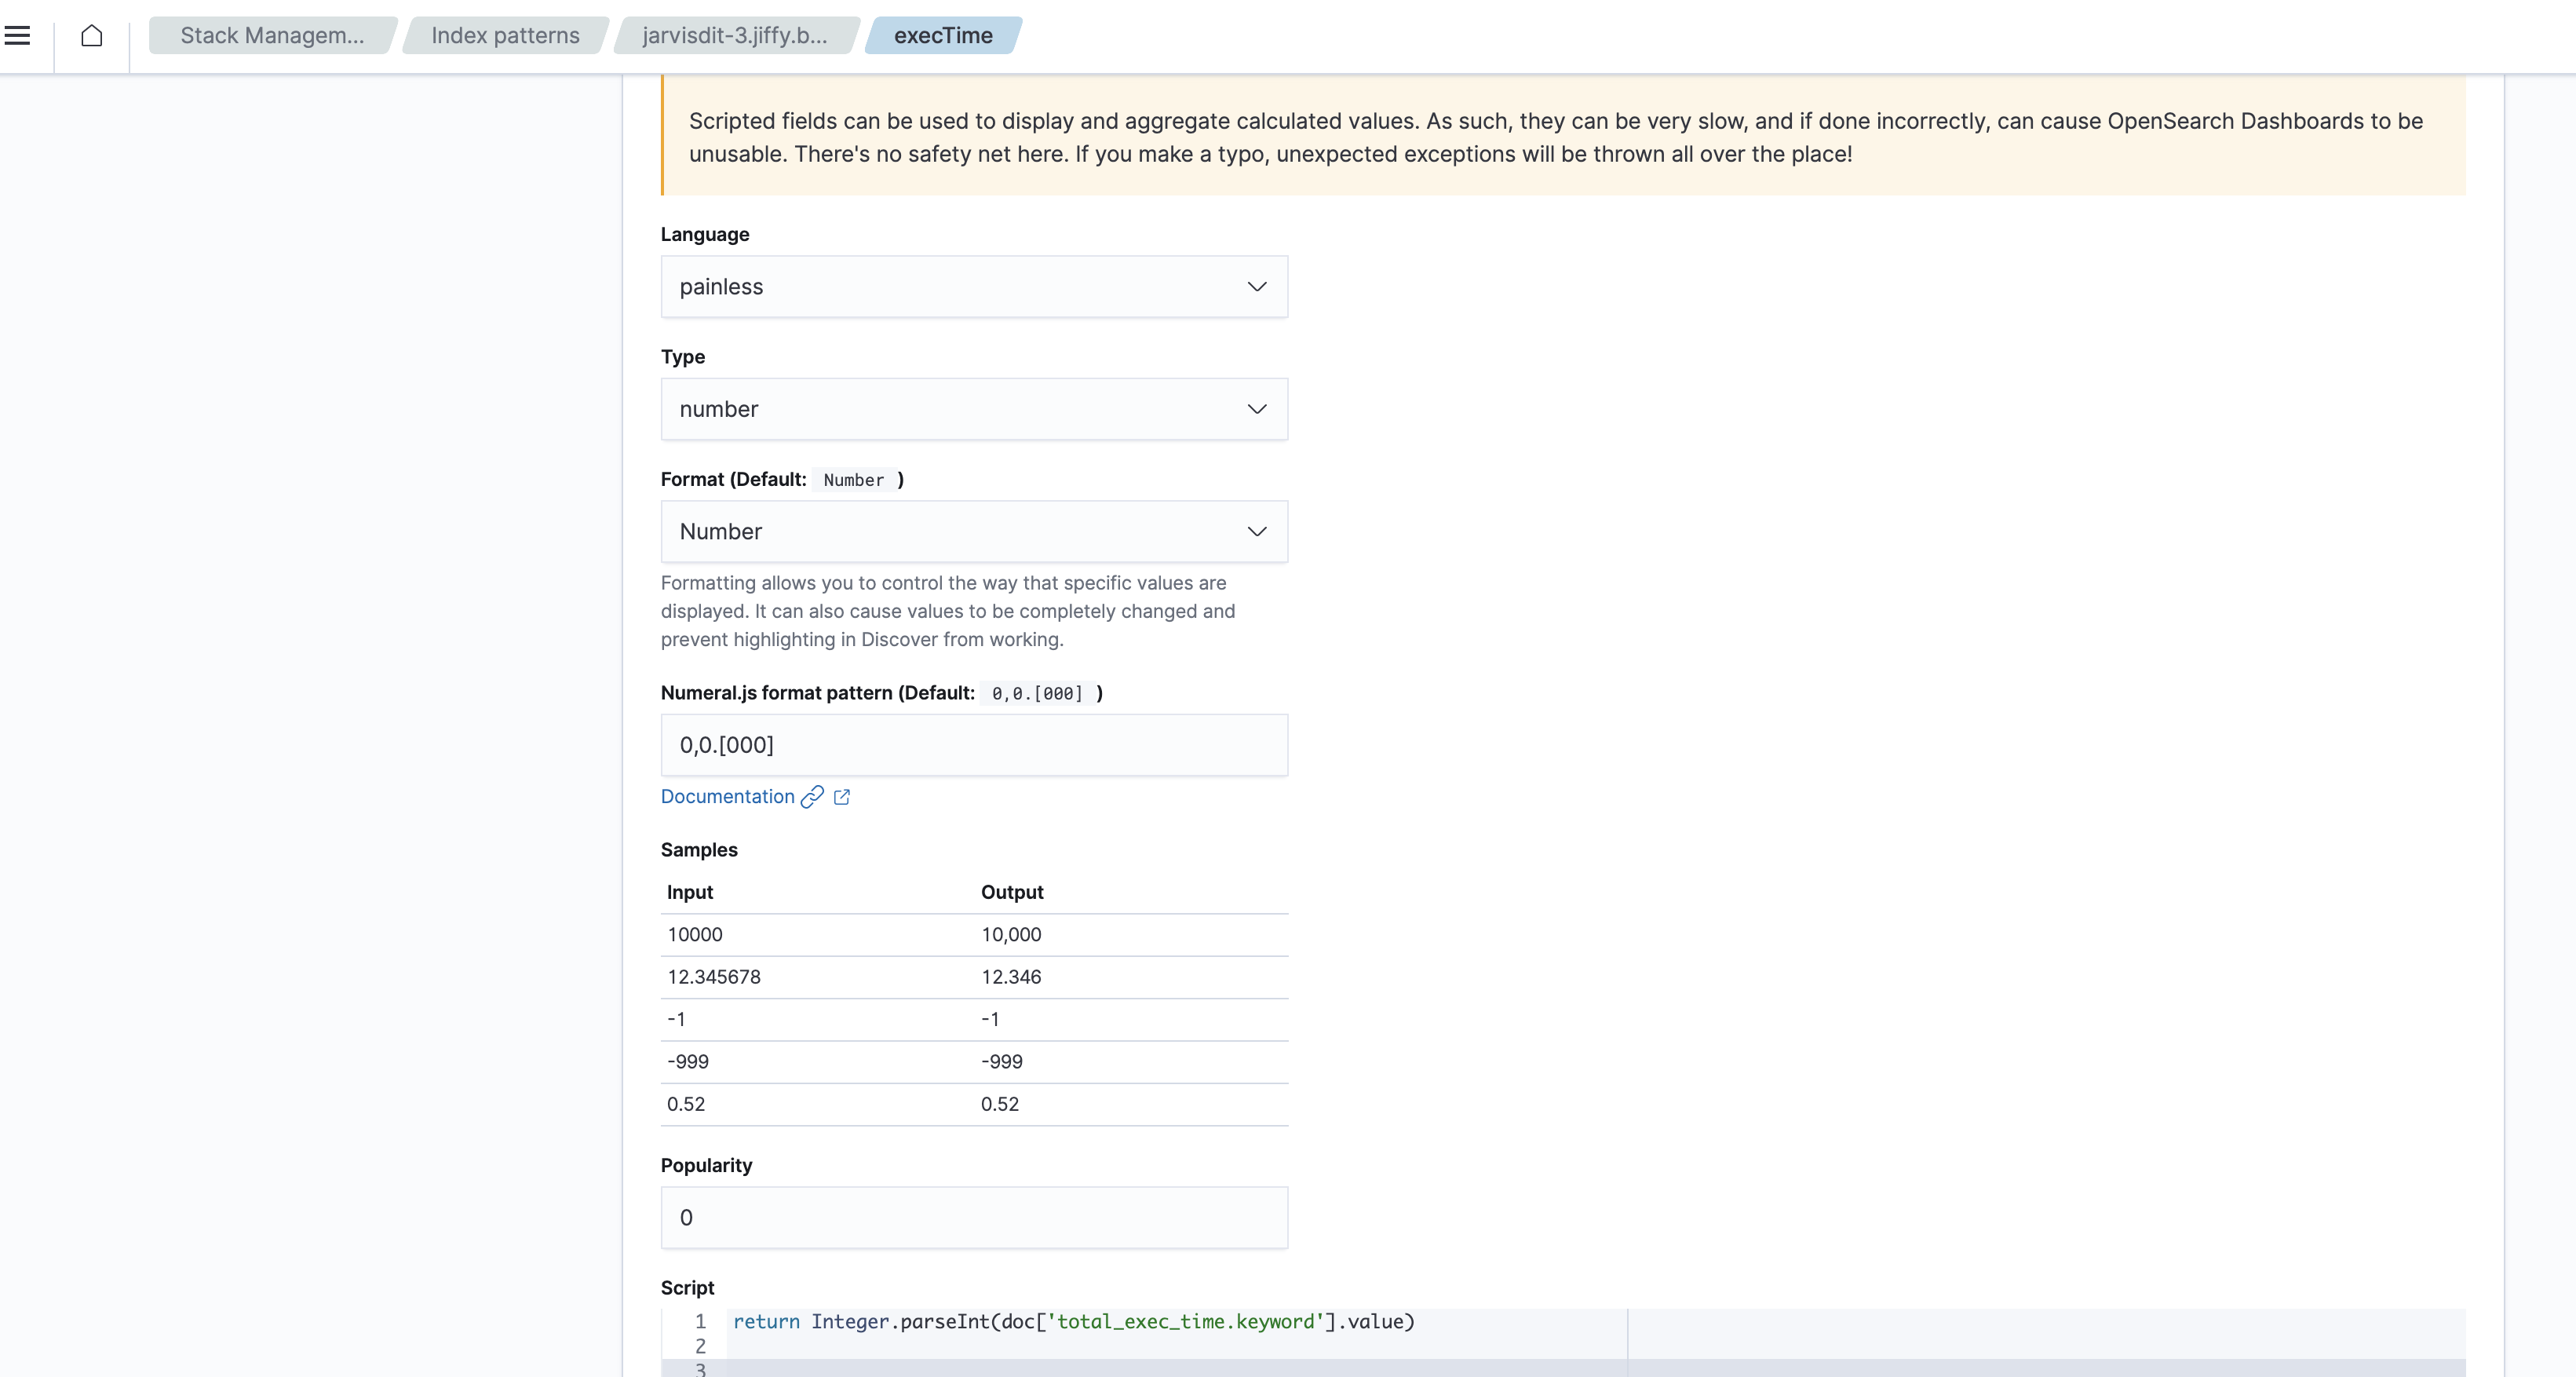
- Add Scripted Field execTime in number format.
- execTime as Scripted Field is shown below.
- Refresh the bot_task_logs index.
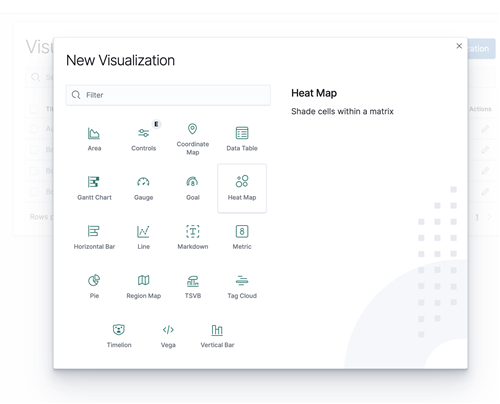
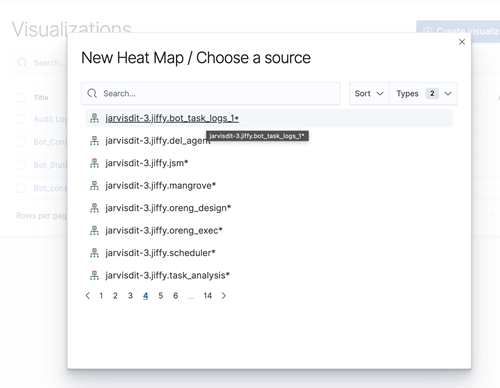
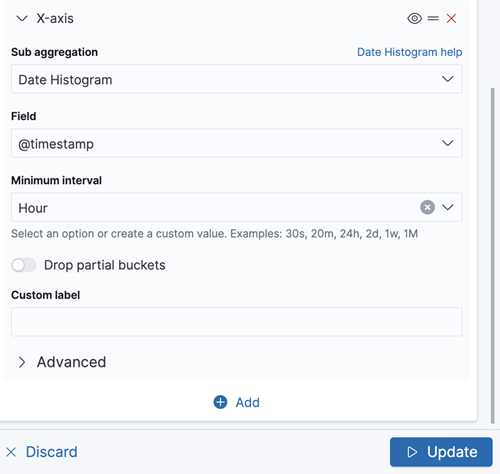
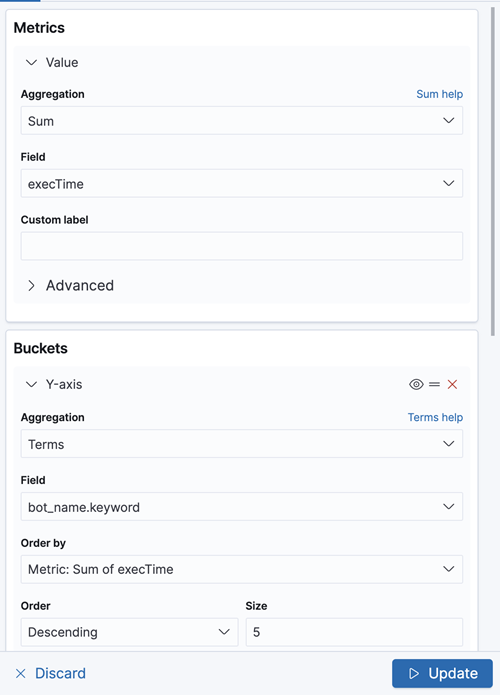
- Create a visualisation as heatmap.
- Use the index bot_task_logs.
- Each block shows bot utilization in number of seconds.
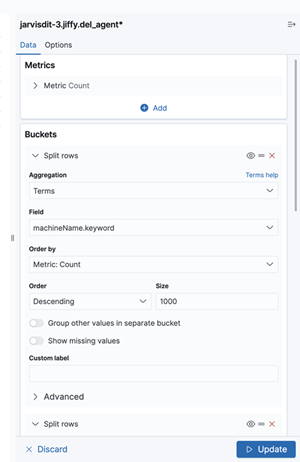
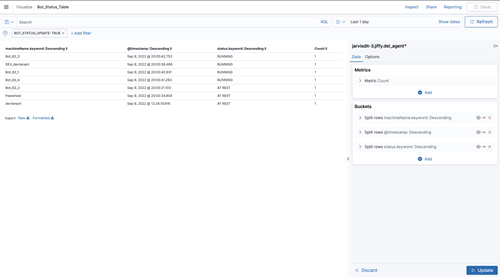
Bot Live Status
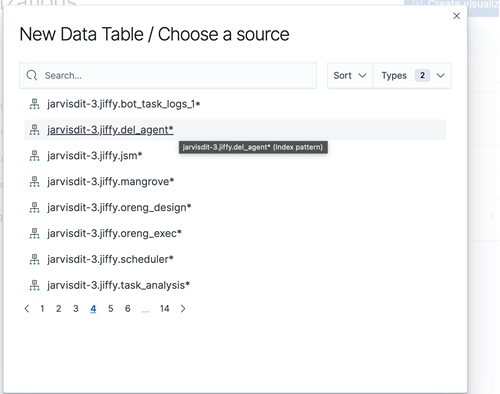
- Create visualization as Data table.
- Select index as del_agent.
- Apply filter for that index.
- Add bucket and select the config as below.
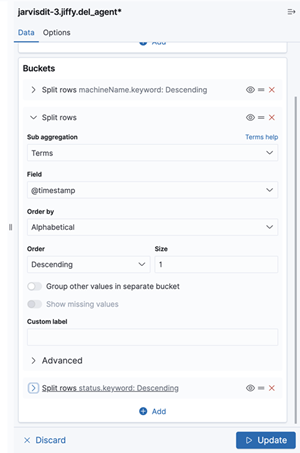
- Split Rows as per the timestamp and apply size 1.
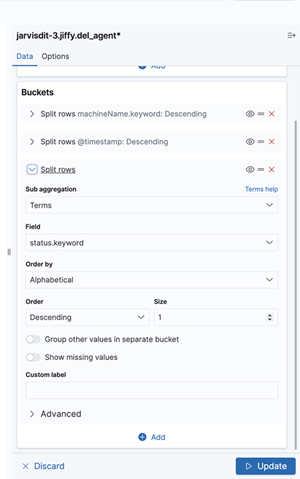
- Split rows by Status and apply limit as one.
- After this, you can see the live status of the bot in the Datatable.
More Sample Dashboards
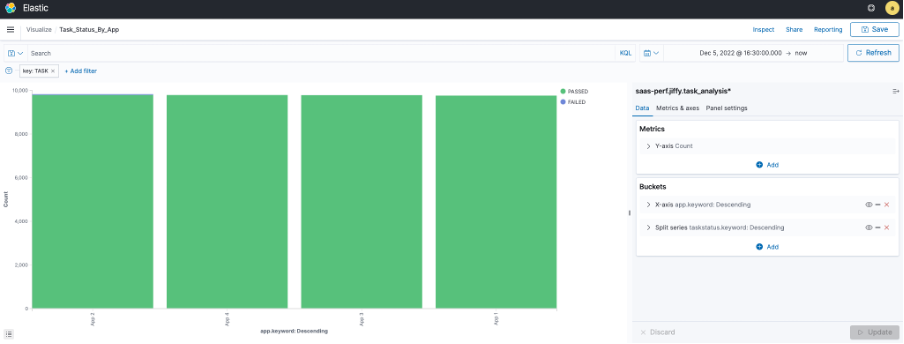
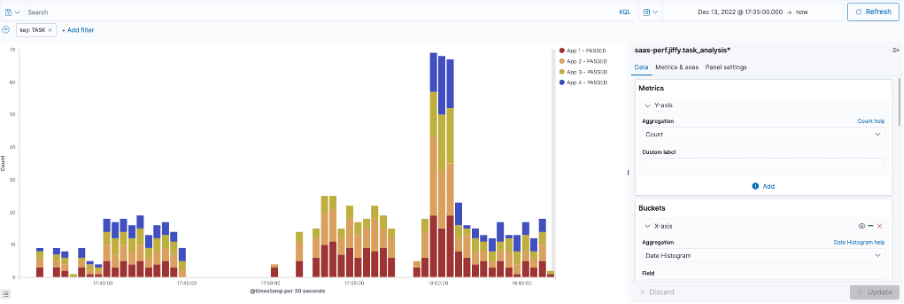
Task status by App
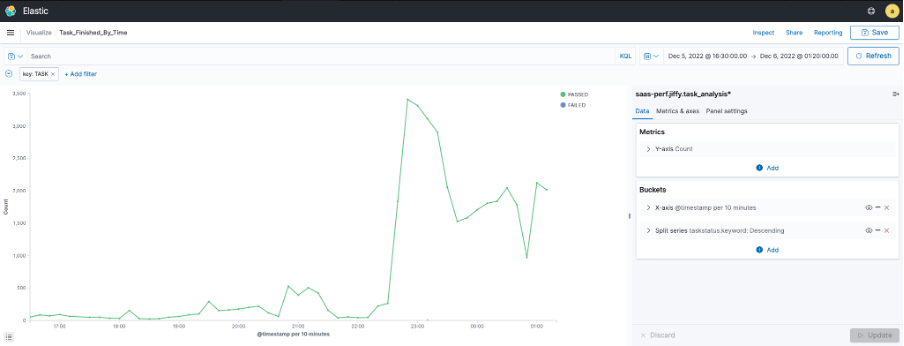
Task Execution Rate with Pass and Fail
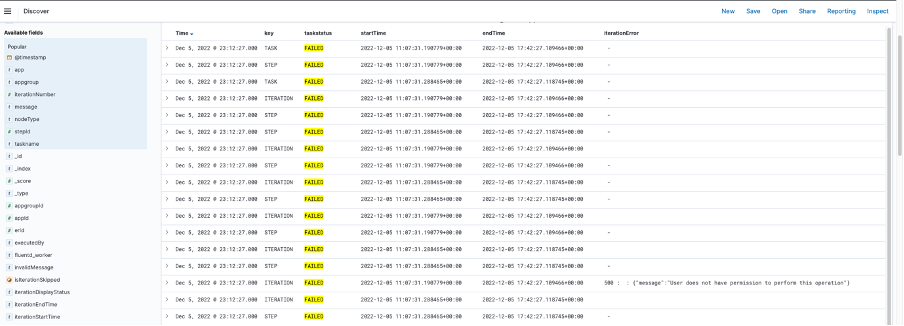
Failed iteration with Error Message