
Customize Axis
Last Updated: Mar 8, 2023
Last Updated: Mar 8, 2023
An axis shows data points that lie within a range of values. For each axis, you can specify the range, scale, and many other properties.
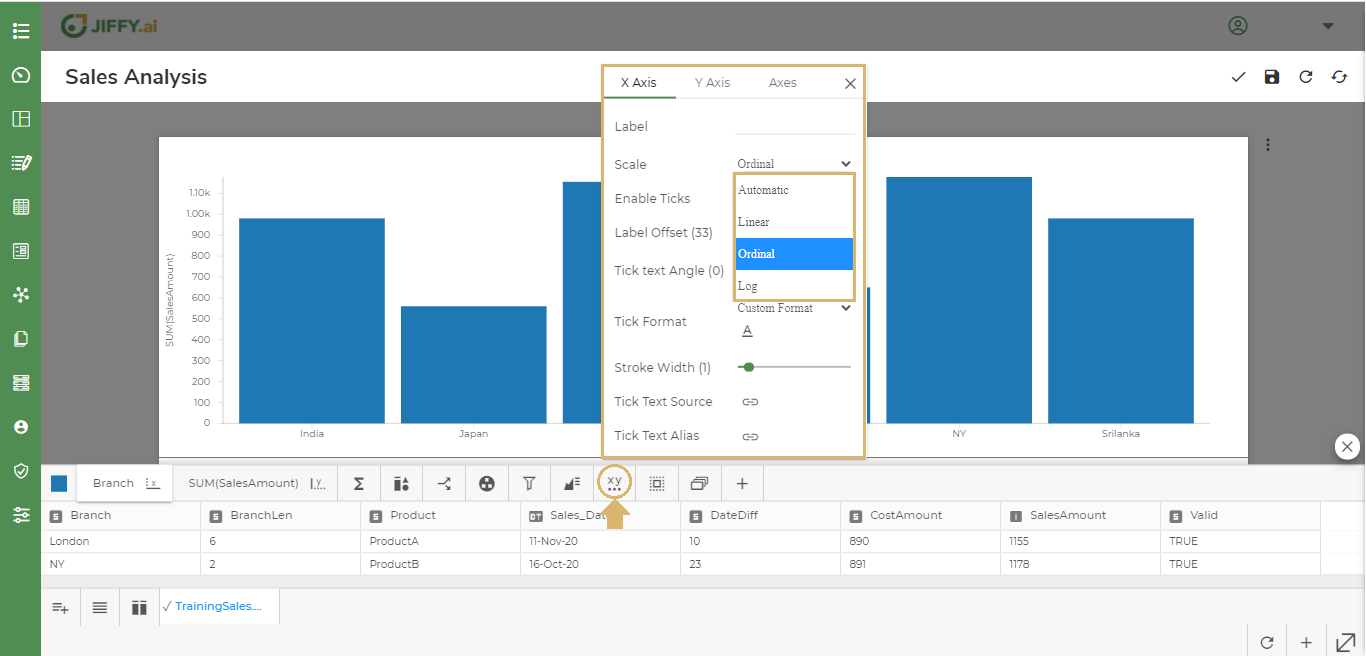
Click the ![]() icon to change the Axis Properties.
icon to change the Axis Properties.

You can change the scale of the axis to Automatic, Linear, Ordinal or Log types.
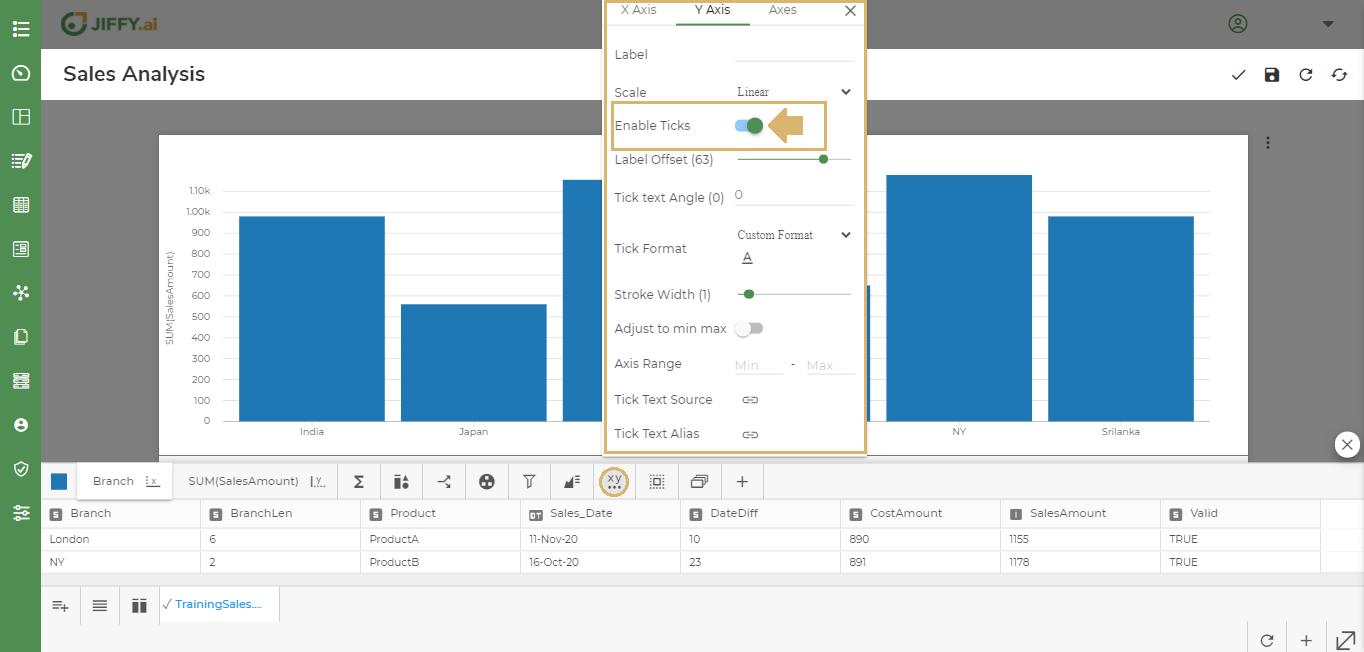
You can enable ticks to show the lines in x-axis and y-axis.
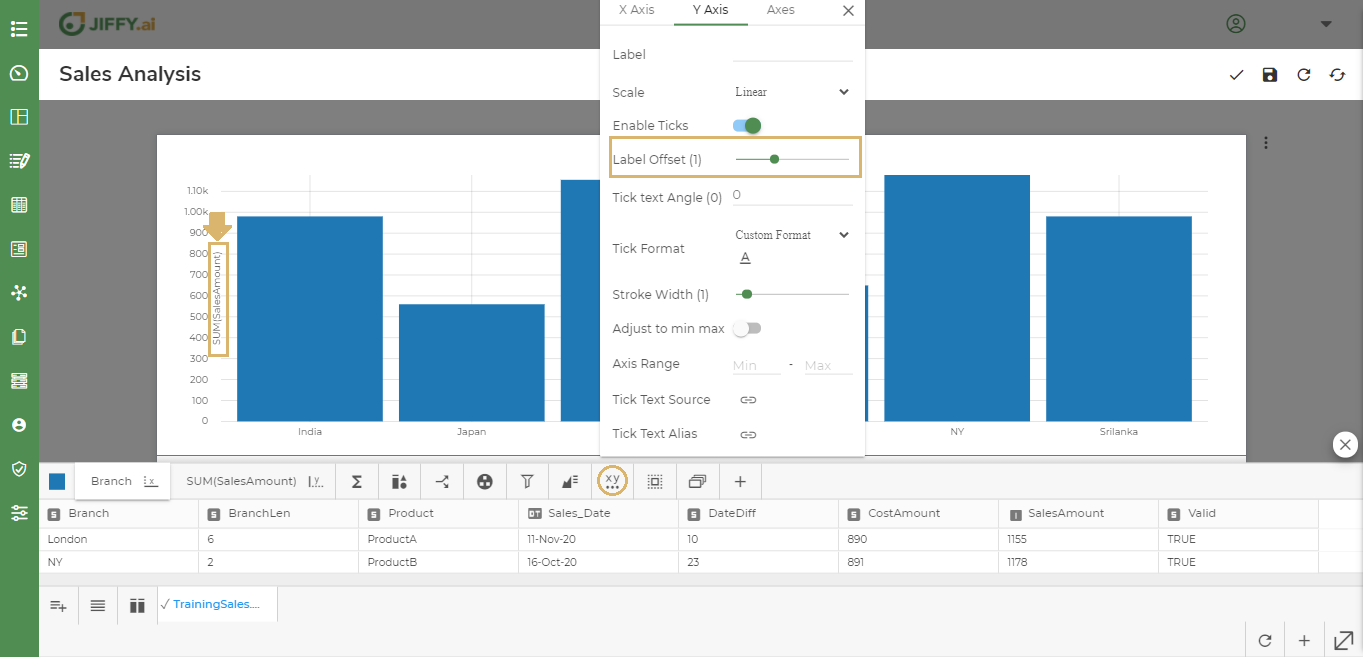
You can change the Labels position in the Chart.
In the below example, y-axis Label SalesAmount offset position has been reduced to 1, so it appears closer to the Bar.
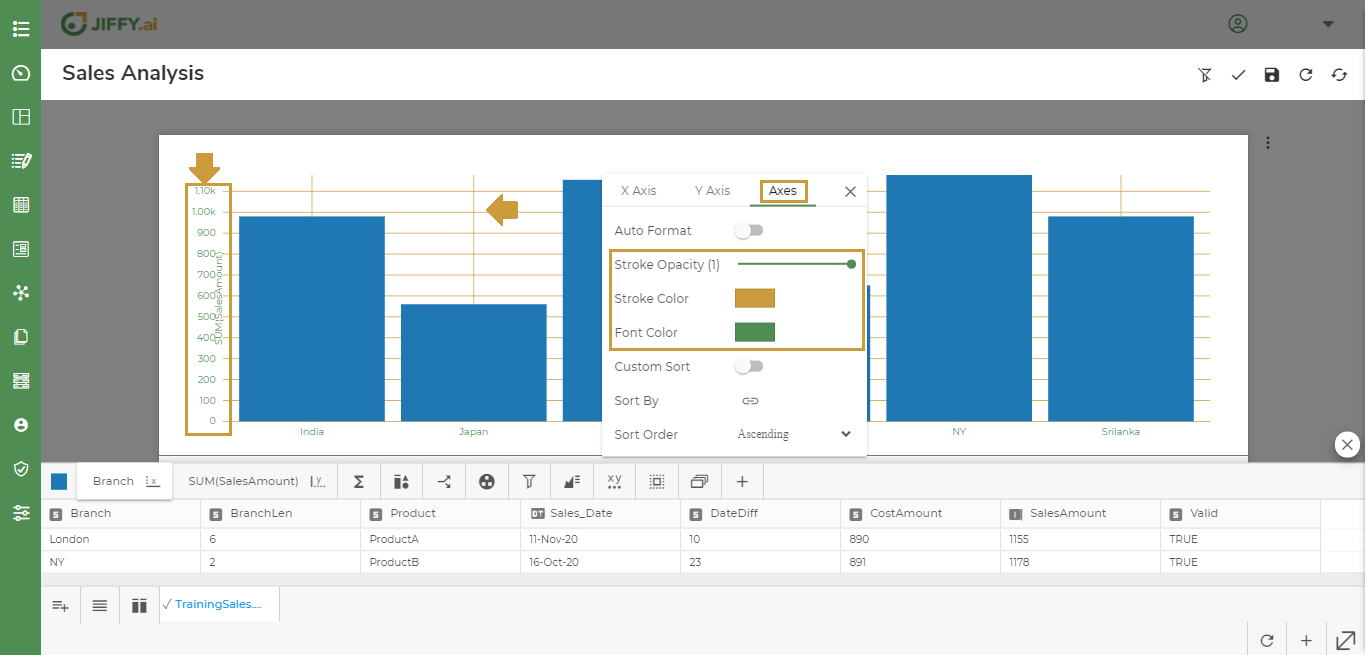
You can change the x-axis and y-axis Stroke Color, Stroke Opacity, Font Color as shown below.
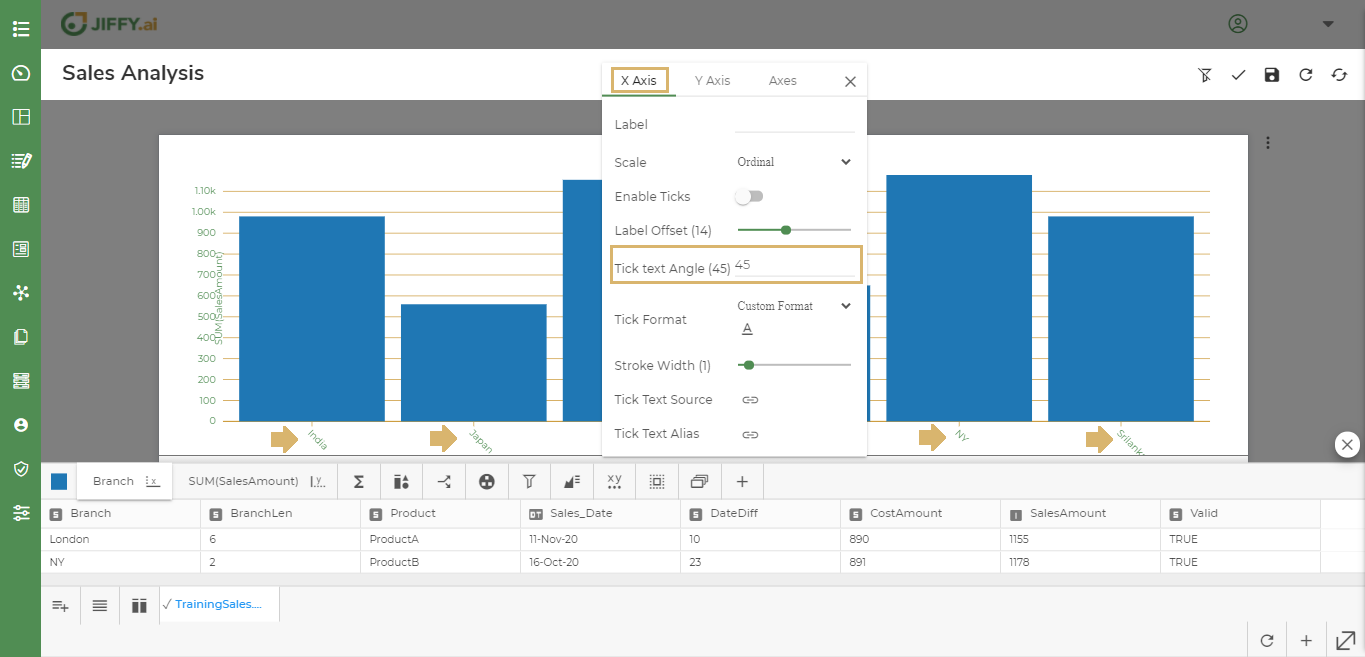
You can change the Tick Text Angle as required. This option is useful when the tick texts are long and overlapping.
In below example, x-axis Branch names are tilted to 45 degrees.
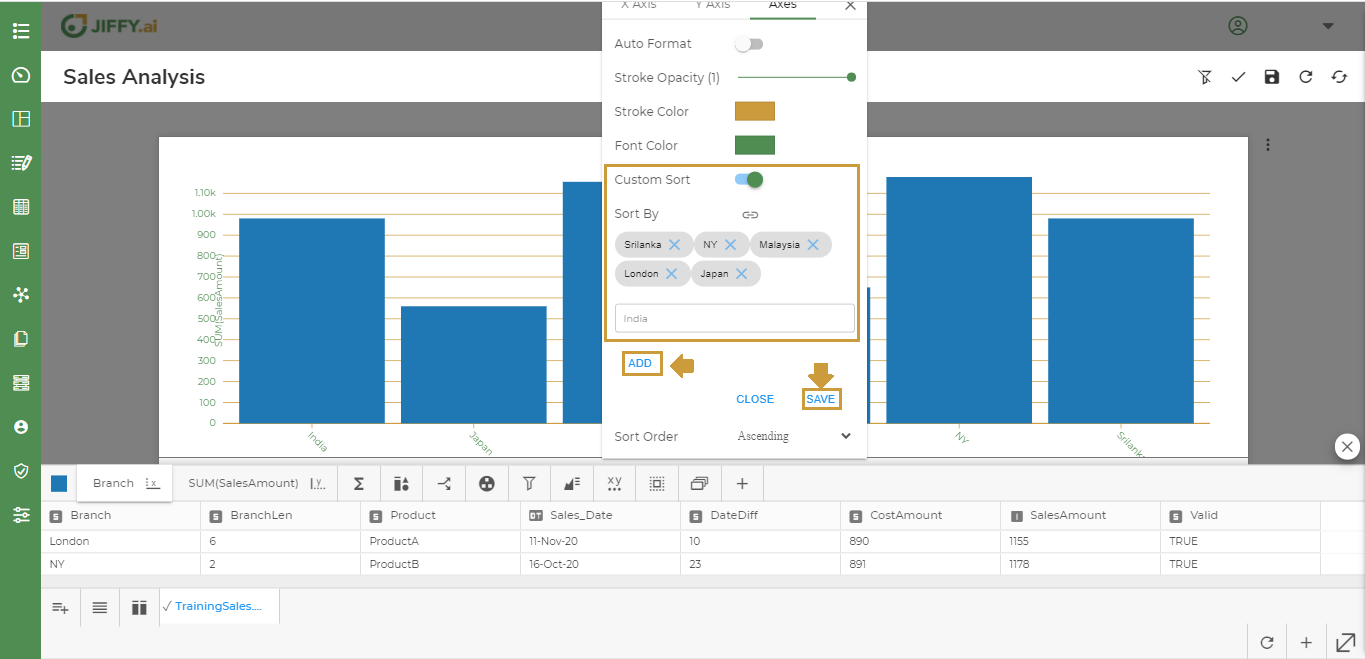
By default, the axes values are sorted alphabetically. Use this option, to custom sort the display. For example, to view the vertical bars on x-axis in Branch order of Srilanka, NY, Malaysia, London, Japan, and India, change it using this option.
Provide the sort by values and click on ADD and SAVE.
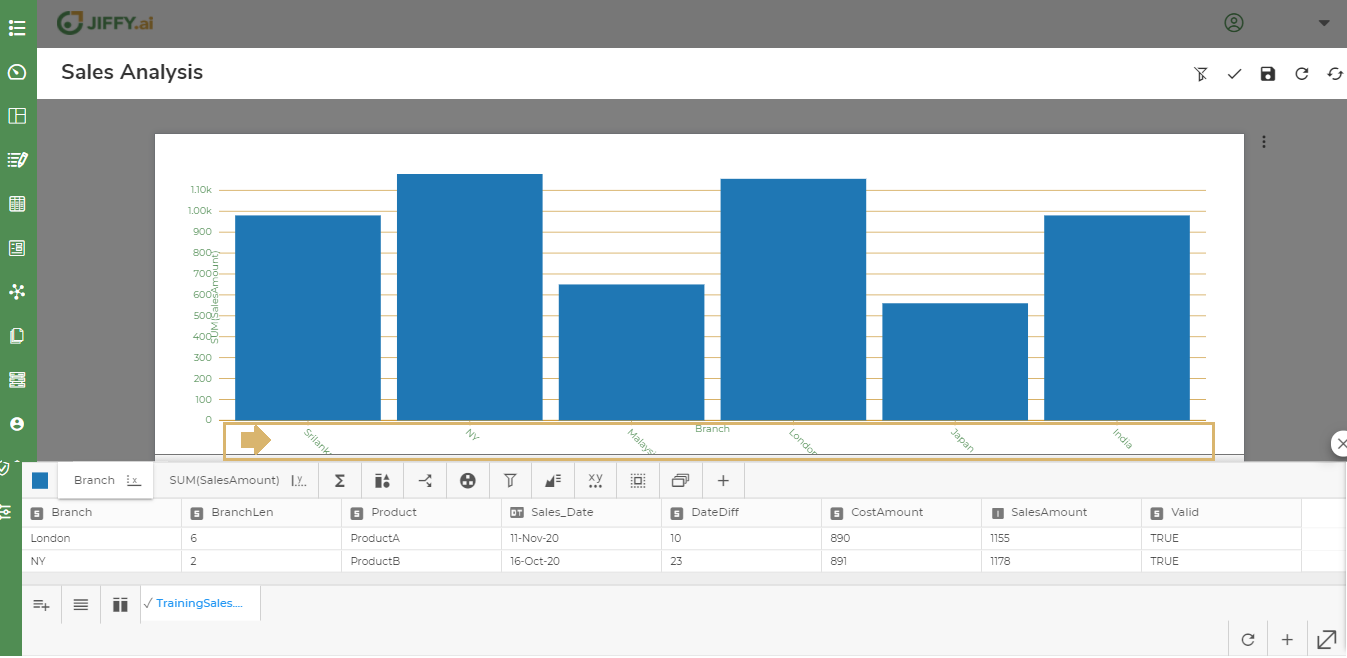
In the below example, the values are changed as per the order.
Use the Sort By option to select the field by which you want to sort the axes values.
Use the Sort Order option to select either Ascending or Descending order of sort, for the field selected in Sort By.
Click the ![]() icon, select Branch, set Sort Order as Descending.
icon, select Branch, set Sort Order as Descending.
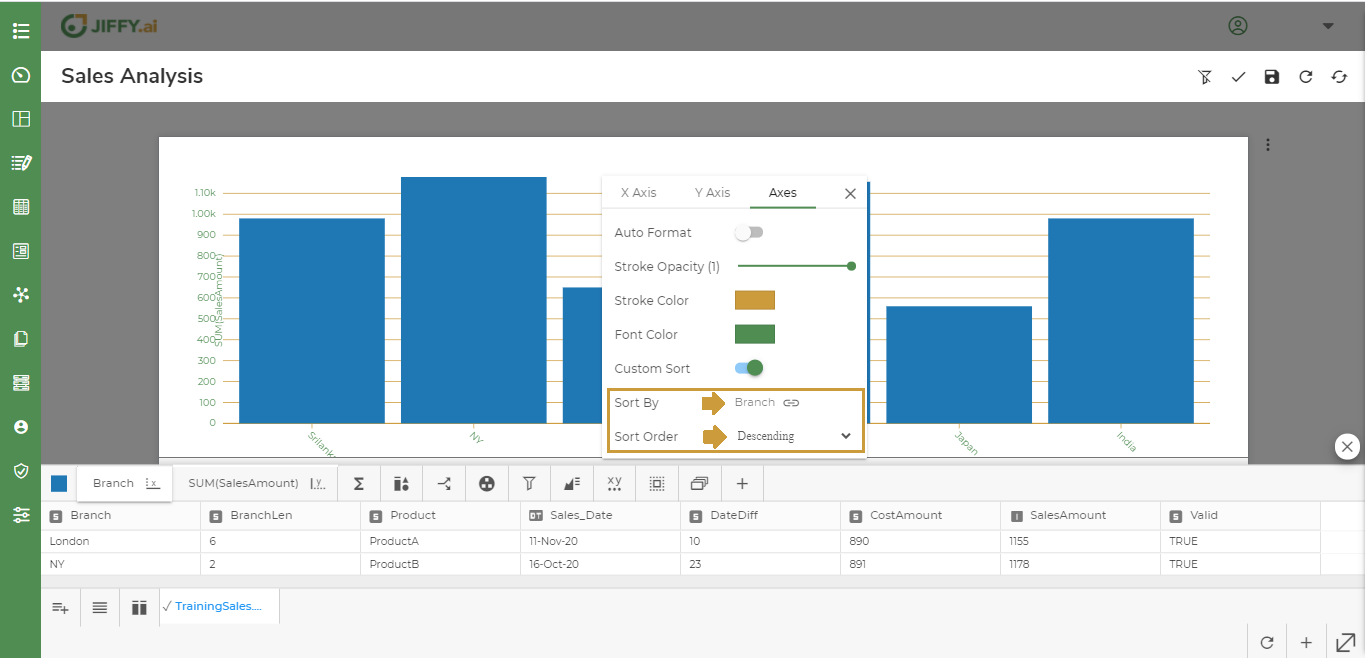 For the above example Chart displays data sorted by Branch in Descending Order.