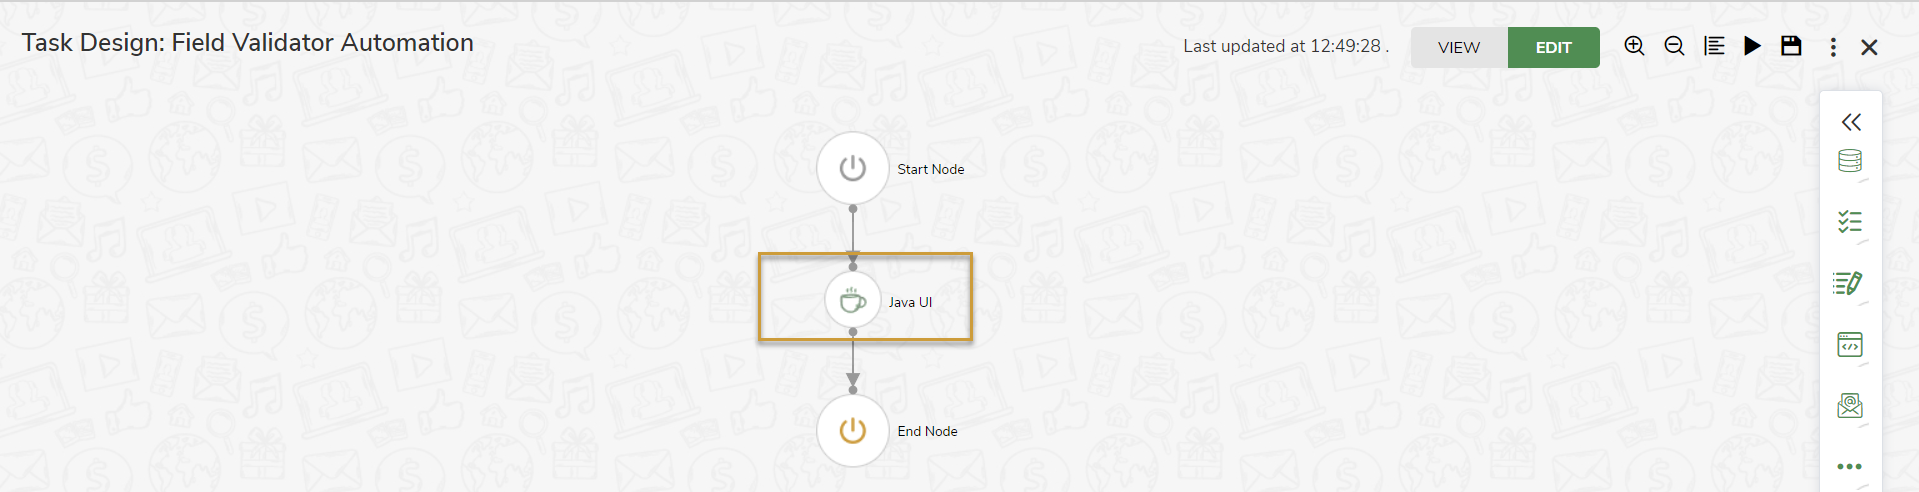
The Java UI node is used to automate the user interface of any Java Applications.
In the Field Validator Java Application, user interface is automated using Java UI node.
How to run Jiffy Java Automation
Jiffy Java automation needs two files to run:
- jautomator.jar is the main file.
- jautomatorsh.jar is the trigger file.
Jiffy java automation needs the following environment variables to be set.
- JAUTOMATOR_AGENT_TRIGGER - create a new directory (anywhere on the machine) and point this to the new directory. For example, JAUTOMATOR_AGENT_TRIGGER=c:\temp123
- JAUTOMATOR_FILE_PATH - set this to jautomator.jar. For example, JAUTOMATOR_FILE_PATH=C:\Users\test\jautomator\target\jautomator.jar
- JAVA_TOOL_OPTIONS - set this to -javaagent:For example, JAVA_TOOL_OPTIONS=-javaagent:C:\Users\test\jautomatorsh\target\jautomatorsh.jar
Security settings
The following section needs to be added in java.policy and javaws.policy files under lib\security of the jre\jdk being used to launch java apps.
grant {
permission java.security.AllPermission;
};
Debugging options
To debug Java process details (especially when JRE is launched from IE) set the following variable in environment variables and re-start IE.
- JPI_PLUGIN2_DEBUG 1
- JPI_PLUGIN2_VERBOSE 1
The logs can be found in the following directory:
C:\Users\\AppData\LocalLow\Sun\Java\Deployment\log
Java debugging
The following command line options need to be passed to java while running to start remote debugging.
-Xdebug -Xrunjdwp:transport=dt_socket,address=8998,server=y
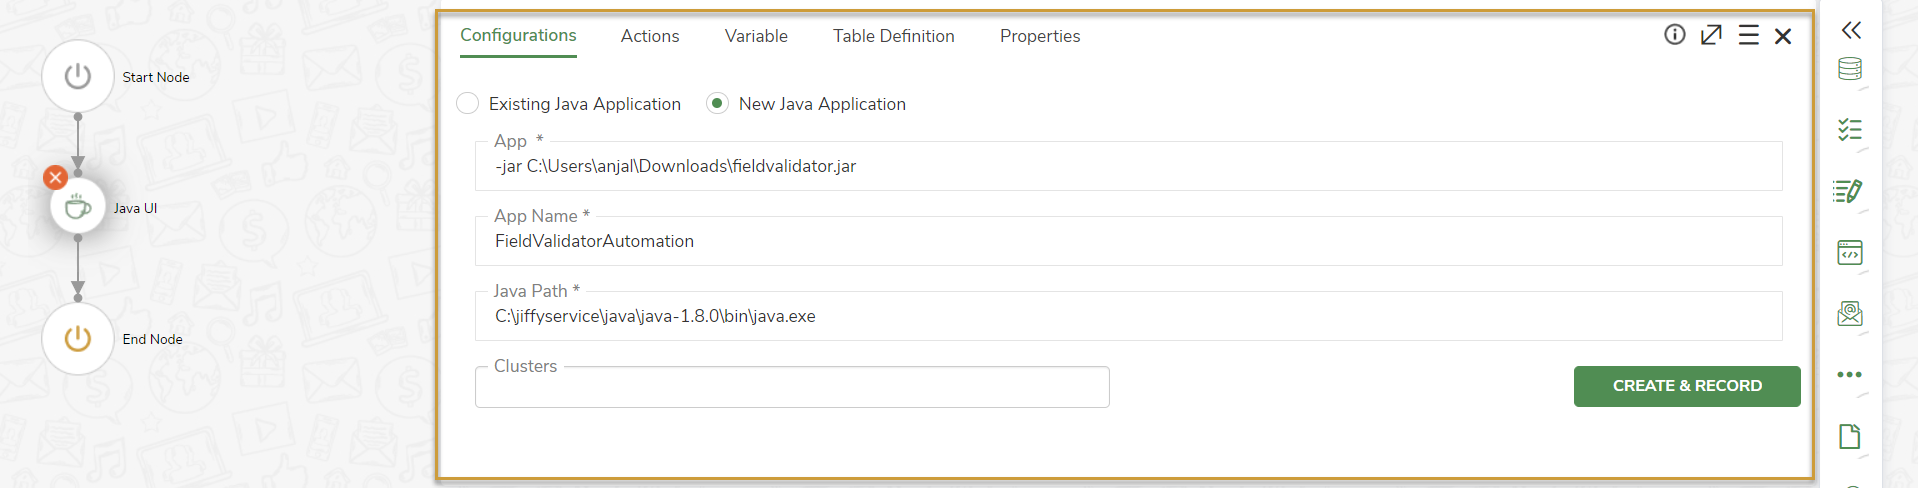
Configurations of Java UI Node
- Click the Java UI node to open the attributes pane.
In the Configurations tab, enter the following details:
- App: Path of Java application to be automated.
- App Name: An intuitive name for the application being configured so that it can be reused across similar process automation.
- Java Path: Path of Java application(.exe) in jiffyservice folder.
- Cluster: Select Cluster from the drop-down if you wish to run the node on Cluster. Otherwise, leave it blank.
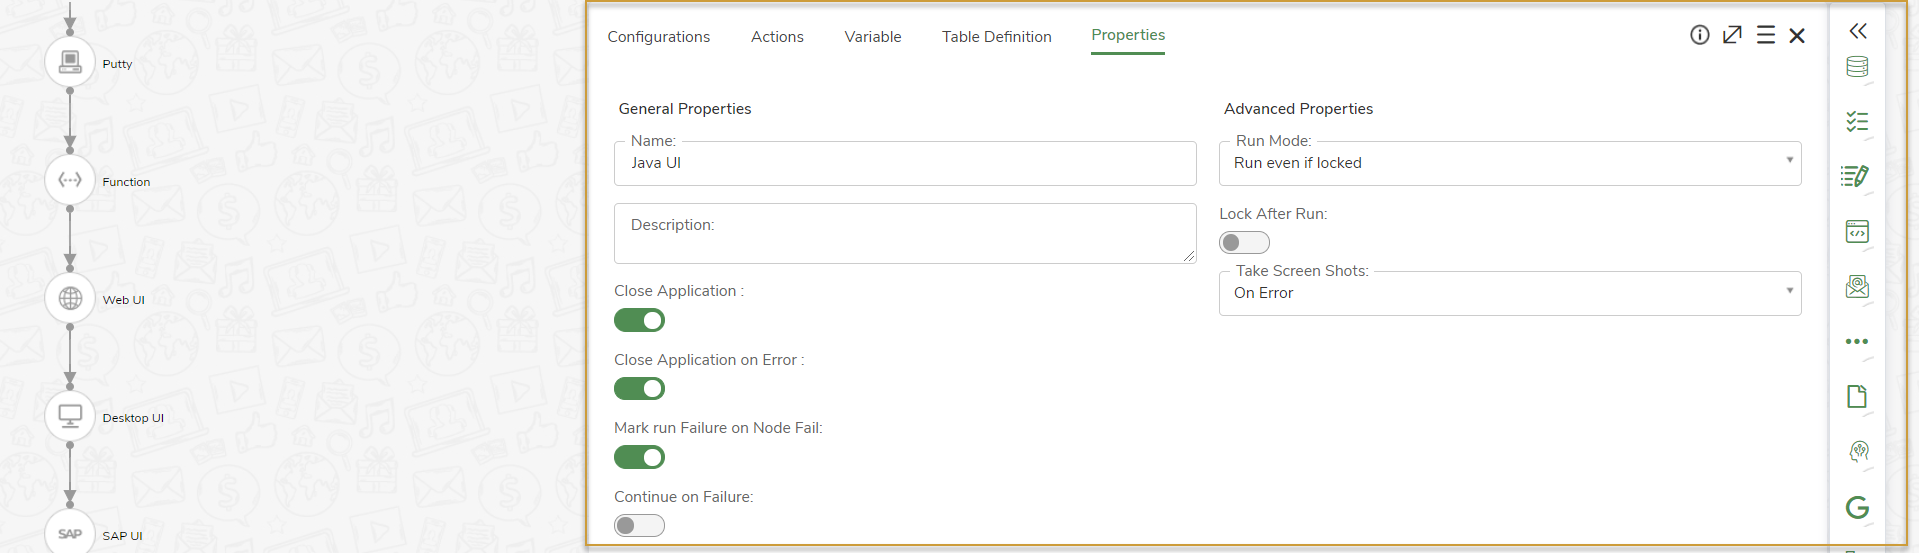
Properties of Java UI Node
- Navigate to the Properties tab, enter the Name and Description.
- Select the options for Run Mode and Take screenshot fields from the drop-down.
- Enable Close Application, Close Application on Error, Mark run Failure on Node Fail, Continue on Failure, and Lock After Run options as required.
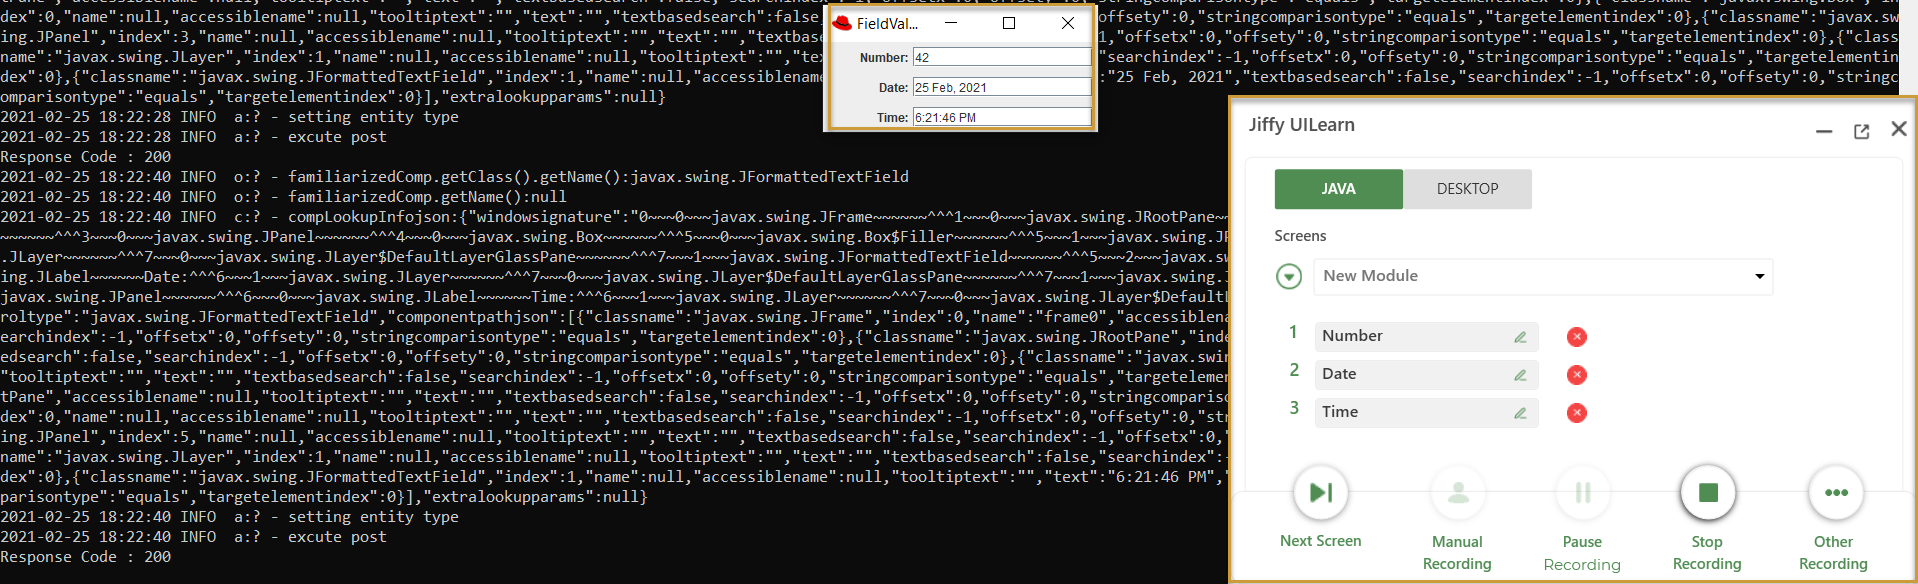
Record UI of Java Application
There are two ways to record UI of Java Application.
Hover the mouse cursor on the UI element to be recorded and press Press Ctrl key. To know more about how to record UI elements, click here.
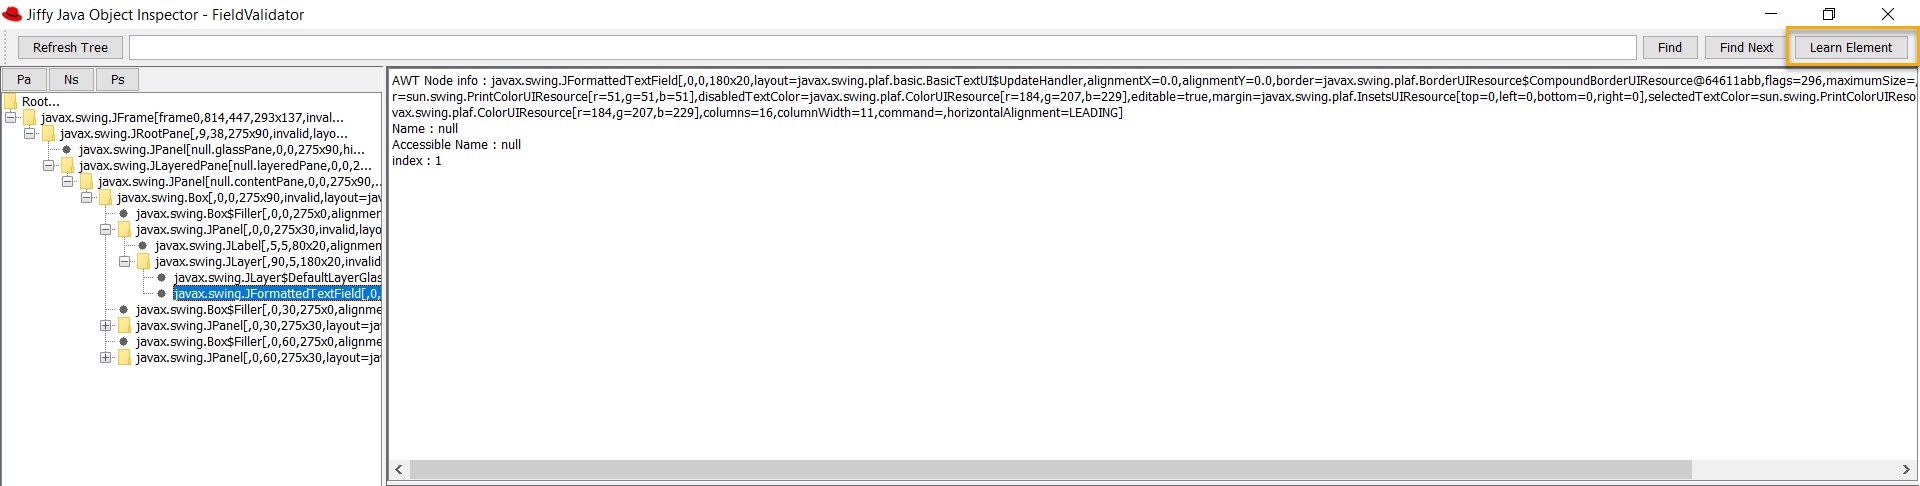
Alternate Way of Recording
- Click the Show Object Browser button from the Jautomator tool bar.
Jiffy Java Object Inspector page opens.
- Select the element to be recorded from the tree structure.
- Click the Learn Element button.
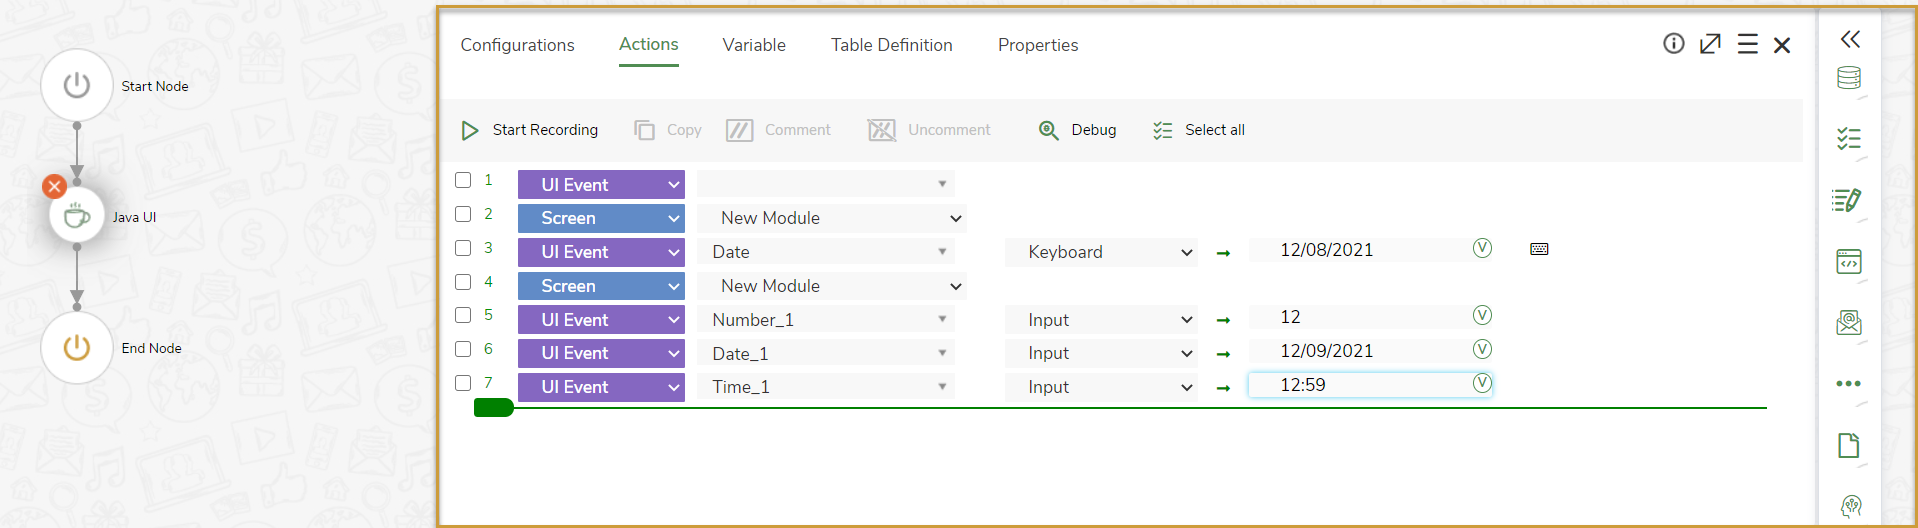
Actions in Java UI Node
In the Actions tab, all the recorded UI events are listed where you can design and modify the actions.
Variables
All Input/Local variables created for the node are displayed under Variables tab.
Table Definitions
All Default and Custom DataTables created in the task are displayed under Table Definitions tab.
Result of Execution in Java UI Node
After executing task, Result of Execution window is displayed with the following tabs.
- Input: The input variables mapped to the Java UI node are displayed.
- Output: Execution status and the values of the output variables in the current node that can be mapped to the succeeding nodes are displayed.
- Run Info: The Run Details, Configuration Details, and Machine Details are displayed.
- Run Details include Run ID, Sequence Number, Iteration ID, and Total Node Execution Time (in seconds).
- Configuration Details include Configuration Name, App, Application Path, Clusters, and Config Level.
- Machine Details include ID, Name, Host, Port, Iteration Start Time, Iteration End Time, and Iteration Time (in seconds).
- Step Data: The details and status of the each Line of Action inside the node are displayed.
- Formatted Output: The table data of the output variable with Type selected as Table is displayed.

.png)